Litecoin (LTC) Primed for Surge: Can It Shatter the $300 Barrier in 2025?

Litecoin flexes bullish momentum as traders eye a potential run at $300—silver to Bitcoin’s gold finally gets its shine.
The Setup:
After months of sideways action, LTC’s chart prints a textbook consolidation pattern. Breakout whispers turn to shouts as volume ticks up.
The Target:
That $300 level isn’t just psychological—it’s a liquidity magnet. Last tagged during the 2021 mania, it’s now back in play as institutional FOMO seeps into altcoins.
The Catch:
Macro headwinds could spoil the party. Fed rate decisions loom like a guillotine over crypto’s neck—because nothing says ‘decentralized’ like hanging on Powell’s every word.
Watch the weekly close. If LTC holds above $180, the path clears for a full send. If not? Well, there’s always 2026… or another ‘halving hype’ cycle to pump the bags.

- Litecoin tests key resistance at $113–$115, eyeing breakout targets at $130, $145, and $300.
- Open interest is up 1.94%, with sentiment turning cautiously bullish among traders.
- Volume is down 21.74%, but structure remains strong; watch for OI and volume spikes.
Litecoin (LTC) is gaining traction throughout the entire crypto community and experiencing a surge in its value within the entire crypto community. The LTC price over the last 24 hours is up by 2.16%, and over the last week it is also up by 10.21%.
The general market trend is now turning bullish as BTC has started its movement towards its ATH around $123,000. This surge in price has affected the overall market, including altcoins such as Litecoin.
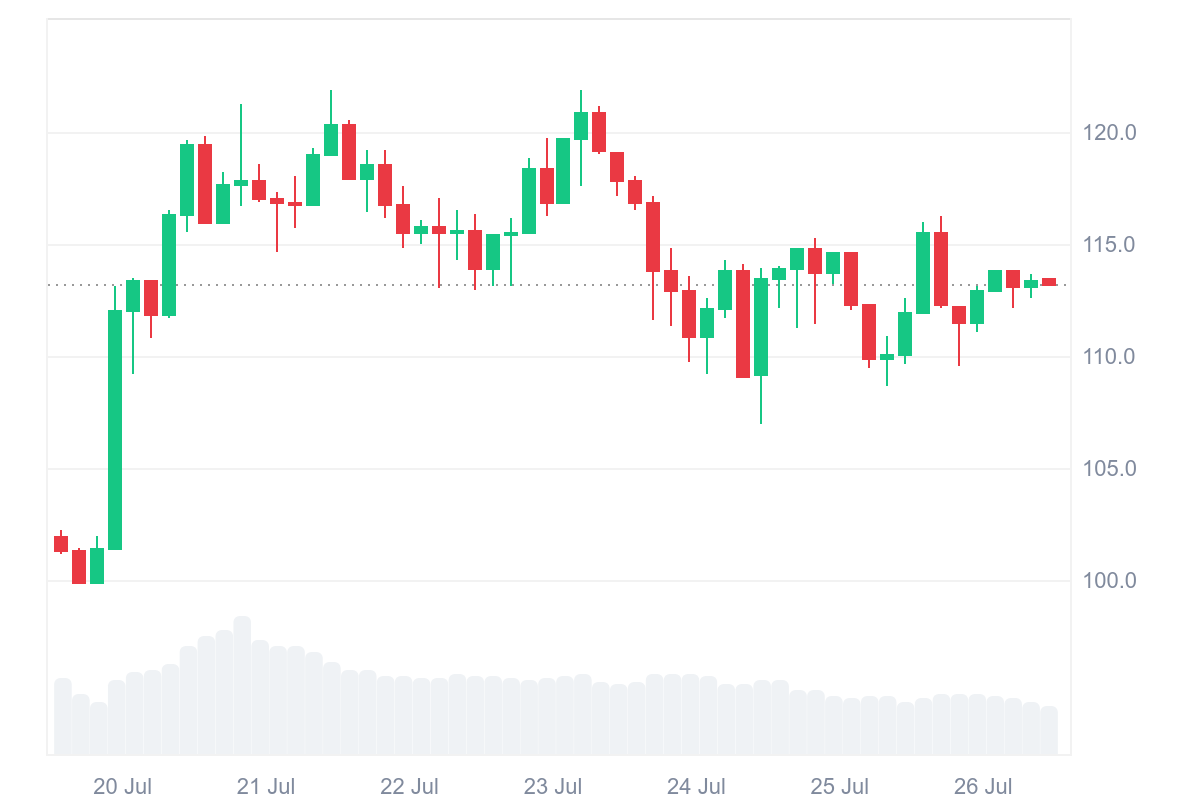
Currently, LTC is trading at $113.23 with a 24-hour trading volume of $825.24 million, down by 9.81% over the last 24 hours. The coin has a market capitalization of $8.61 billion, which is up by 2.17%.
Litecoin Eyes Breakout and Poised to Break $300
Litecoin (LTC) is facing minor resistance between $113 and $115, where the upper Bollinger Band also aligns. The price is staying above its 20-week EMA ($95.39), which is a healthy sign, and the 100- and 200-week EMAs ($92.03 and $89.01, respectively) are acting as great underlying supports.
These are key accumulation areas and are a sign that the base is being held by the bulls, and they plan to create momentum from this region.
Technically, if LTC succeeds in closing above the $115 area of resistance, the subsequent near-term goal lies between $130 and $145 and the $300 area, which presents a historical area of resistance where historical supply and price rejections occurred in the past.
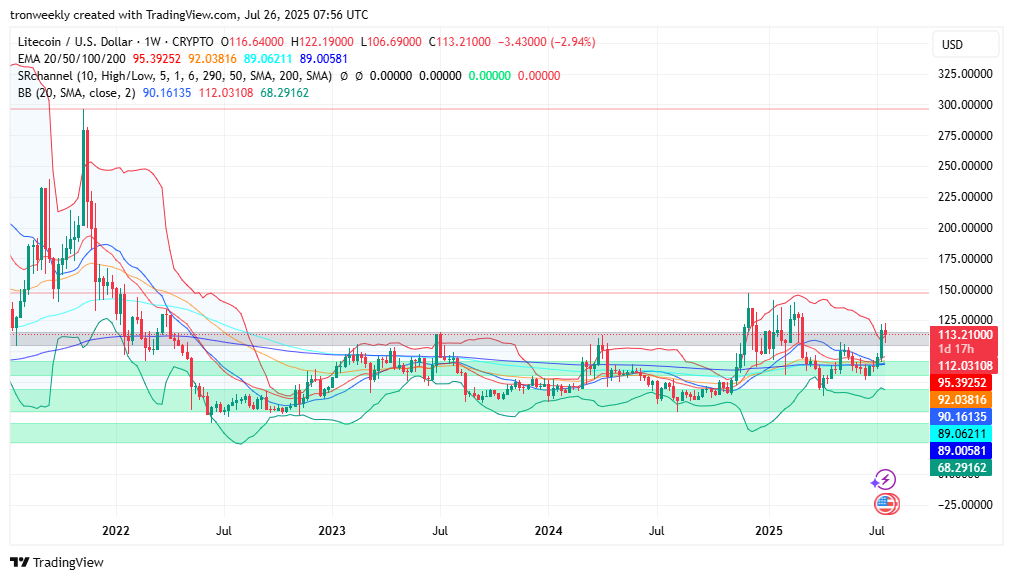
However, if this bull effort fails, a return to the $88–$92 area of support is possible, aided by EMA convergence buildup and previous price reaction areas. The price structure remains largely neutral until a breakout determines trend direction.
Litecoin Derivatives Points to Potential Upside
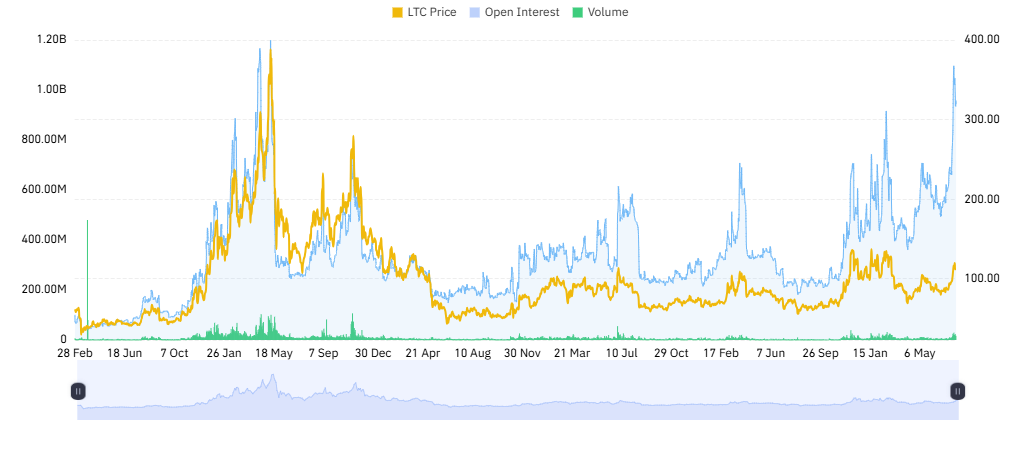
On-chain and derivative information is revealing market sentiment. Open Interest (OI) ROSE 1.94% to $954.90M, signaling heightened speculative sentiment and inflows of capital into future contracts. Such a rise in OI largely indicates that traders are opening up new positions, and that often comes before significant price action.
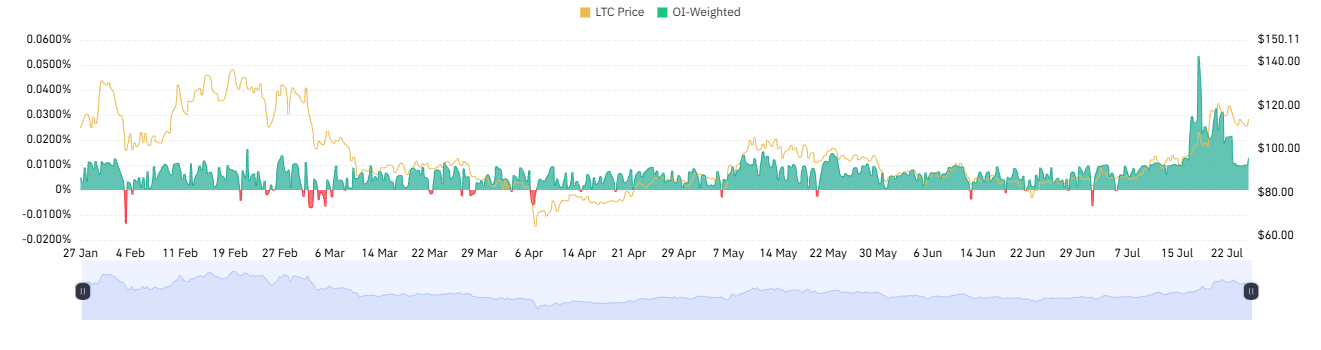
In addition, the OI-weighted sentiment is slightly positive at +0.0129%, indicating that speculative shorts are bullish but are not yet fully bullish. This slightly bullish reading means that Optimism in the market is growing.
Despite that, volume decreased significantly by 21.74% to $1.51 billion, reflecting a wait-and-see approach and cooling-off process amongst retail players. LTC previously recorded major price movements where volume and OI topped simultaneously, which hasn’t been observed yet.
