Bitcoin’s $117,261 Battle: Will the CME Gap Ignite the Next Bull Run?

Bitcoin’s grinding showdown with the $117,261 resistance level has traders eyeing the CME gap like a coiled spring. Will history repeat—or is this just another fakeout for bagholders?
Gaps & gambles: CME’s unfinished business
Futures gaps often magnetize price action, but this one’s got extra spice. The last time CME left a void this juicy, BTC ripped 40% in three weeks. Now? The charts are whispering about a replay.
Wall Street’s favorite casino chip
Institutional flows into CME Bitcoin futures hit record highs last quarter—just as the ‘gap theory’ crowd started circling. Coincidence? Please. These sharks don’t swim without reason.
The cynical kicker: Of course this rally would hinge on a technical quirk rather than fundamentals. Because in crypto, the house always wins… until it doesn’t.

- Bitcoin trades at $117,261, dropping 1.12% in 24 hours, but trading volume rises by 45.74% to $104.47B.
- Egrag Crypto points to the CME gap between $114,440-$115,555, sparking speculation over its fill.
- A drop below $104,500 could signal bigger issues, forcing traders to reconsider the market outlook.
As of press time, BTC is trading at $117,261, indicating a drop of 1.12% in the last 24 hours. Nevertheless, this failure has been countered by the fact that the cryptocurrency has recorded its highest trading volume, which stands at $104.47 billion with an increase of 45.74%. In the past week, the price of Bitcoin has gone down by 0.56%, which makes people wonder about the short-term market trends of the token.
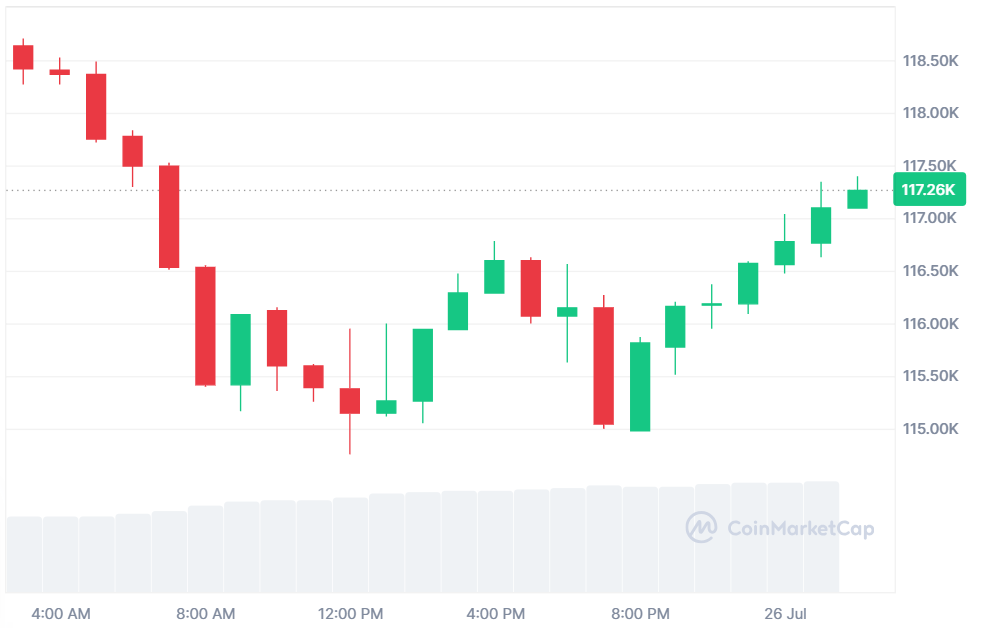
Source: CoinMarketCap
CME Gap and Market Speculation
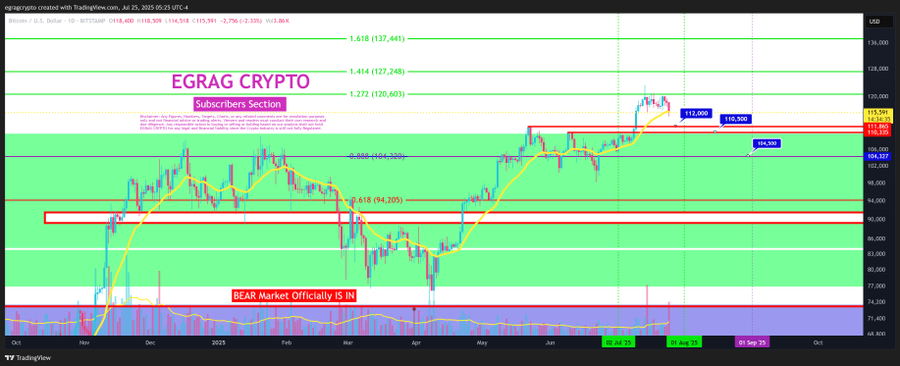
Egrag Crypto analysts highlighted the significance of the CME gap bridging between the range of $114,440 and $115,555. This shortage is creating substantial selling interest among traders who are speculating whether it will be closed in the near term. This gap will be crucial in dictating the next direction of Bitcoin which may have to negotiate this gap.
Analysts have pointed out that $112,000 is a primary support measure of Bitcoin. Nevertheless, a short-term decline to $110,000 may occur, but this should not be a long-lasting period. A closing below $104,500, a vital support area, may become a sign of more serious problems and trigger the review of the bullish prospects.
Source: X
On the more positive side, bitcoin has a number of positive targets in the near future. When the momentum of Bitcoin upwards is sustained, then we may see retracement levels of Fibonacci at $120,603, $127,248, or even $137,411. These levels may provide knowledge about the power of the bullish momentum of Bitcoin and its chances to increase further.
Bitcoin’s Short-Term Outlook
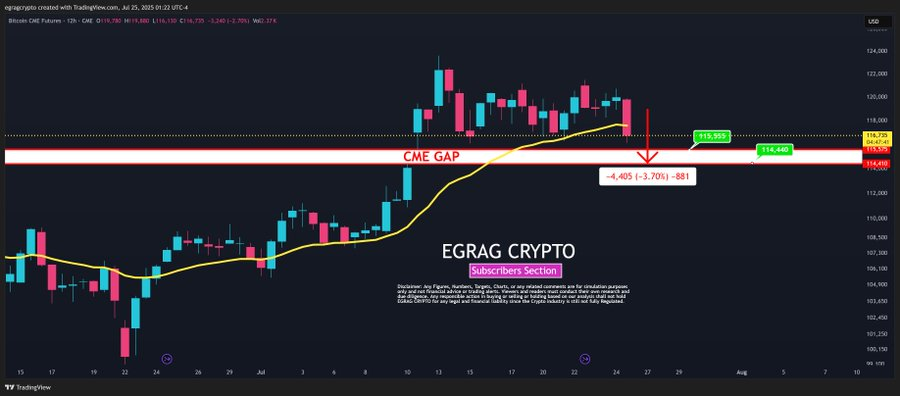
The CME gap has been an area of focus for market observers. In the recent past, Bitcoin has fallen below its 21-day exponential moving average (EMA) in the 12-hour chart, a step that has historically signalled a short down wick. The next important question is whether Bitcoin will make up the gap this weekend or whether traders will have to wait until next week to get some more conclusive price action.
Source: X
The market is concerned about the next move of BTC. The potential gap-filling in CME may be a projection of additional bullish movement in BTC. A dip below key support points, however, WOULD be questionable of the market strength, and traders would have to consider adjusting their plans.
The next couple of days could further define the path of BTC in the short run. With the weekend coming, it will be essential to see the cryptocurrency struggles at major supports or the CME fill to decide whether the bullish run can be maintained.

Log in to Reply
Log in to comment your thoughtsComments
Related Articles
|Square
Get the BTCC app to start your crypto journey
Get started today Scan to join our 100M+ users