Ethereum Eyes $3,000: Bullish Breakout or Impending Crash?

Ethereum flirts with the $3,000 threshold—fueling both euphoria and dread among traders. Is this the launchpad for a historic rally or the calm before a brutal correction?
Market psychology at a crossroads
The crypto crowd splits into two camps: diamond hands betting on DeFi's continued dominance versus PTSD-riddled veterans seeing 2021's crash patterns replay. Liquidity pools swell while short positions quietly accumulate.
Technical tightrope walk
The $3k level isn't just psychological—it's where derivatives markets have stacked massive leverage. One whale's sell order could trigger cascading liquidations (and your favorite influencer will claim they predicted it afterward).
Institutional FOMO meets retail frailty
BlackRock's ETH ETF paperwork gathers dust while crypto-native funds pile in. Meanwhile, retail traders leverage up like it's 2021—because nothing teaches lessons like margin calls and Twitter humiliation.
Closing thought: Whether this becomes 'The Great Breakout' or 'The Reckoning 2.0' depends entirely on which side runs out of dumb money first.

- Ethereum hits $2,975 with a 17.51% weekly gain, RSI nears overbought zone, hinting at a pullback.
- ETH trading volume surges 94.43% to $35.18 billion, showing strong market activity and investor interest.
- Analysts expect ETH to rise to $3,500 after Bitcoin stabilizes from its rapid upward movement.
Ethereum (ETH) is currently trading at $2,975. In the last 24 hours, the price has gained 0.3%. The volume of trading increased by 94.43% to $35.18 billion. Over the last week, the ETH coin price has increased by 17.51%. However, despite this rally, analysts are advising a potential near-term correction.
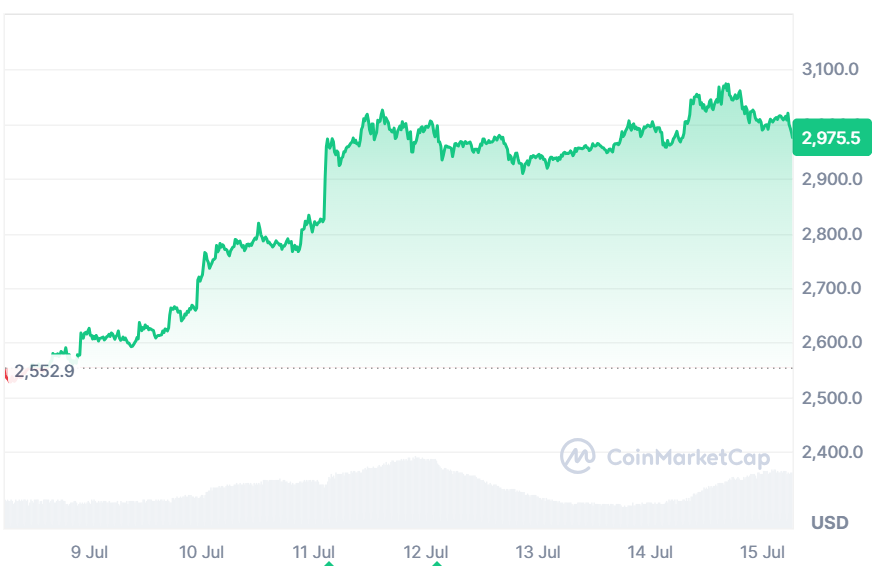
Source: CoinMarketCap
Jip Molenaar highlighted the weekly candle pattern as something of concern. He observed that longer, lower-wick candles have prevailed in 99.1% of the past four years’ total weekly candles. The present one does not. In his view, such a wickless candle possesses a hold rate of just 0.9%. That increases the probability of a pullback before another leg up.
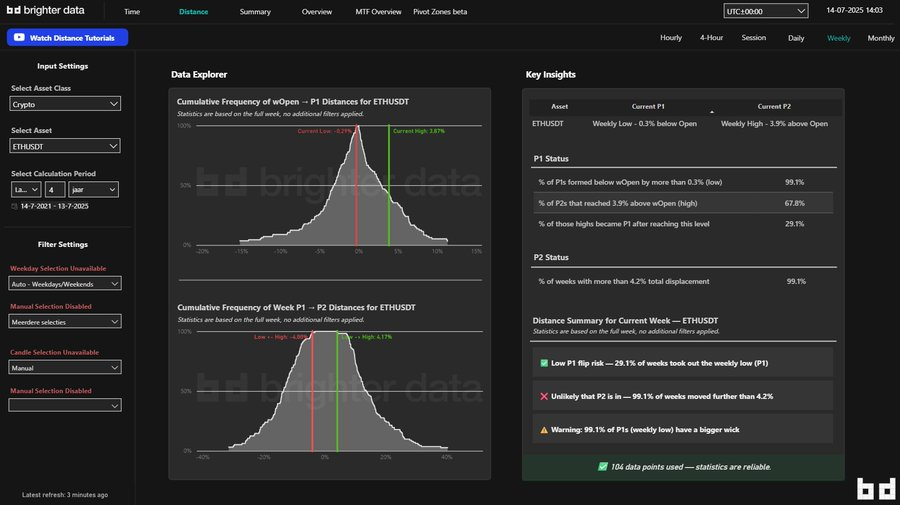
Source: X
Holding Swing Positions
Molenaar indicated he is keeping two long positions as swings. But he is not putting new ones on till the price goes down. He WOULD like to see the present weekly low taken out prior to reentering. Nonetheless, despite vowing to be careful, he is not interested in shorting Ethereum. His long-term bias is still bullish.
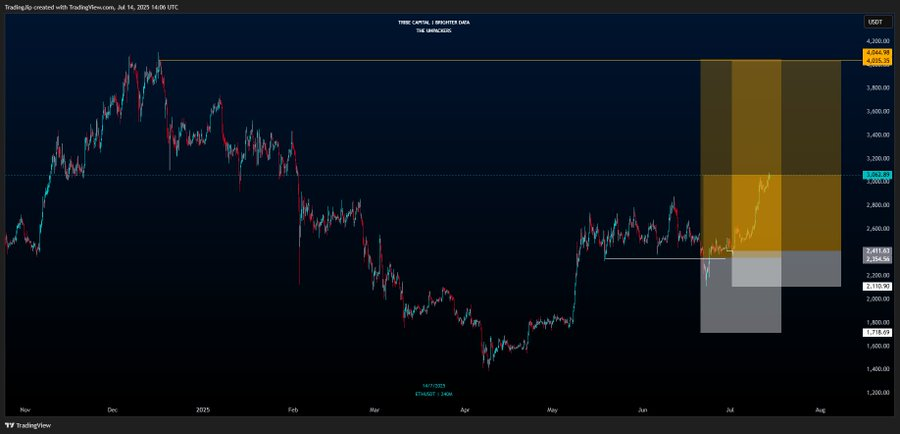
Source: X
According to CoinGlass data, market activity is robust. The increase in volume is by 83.50% to stand at $104.15 billion. Open Interest increased by 4.41% to reach $43.45 billion. The Open Interest Weighted Funding Rate is 0.0098%. Such numbers indicate a stable level of interest in ETH futures.
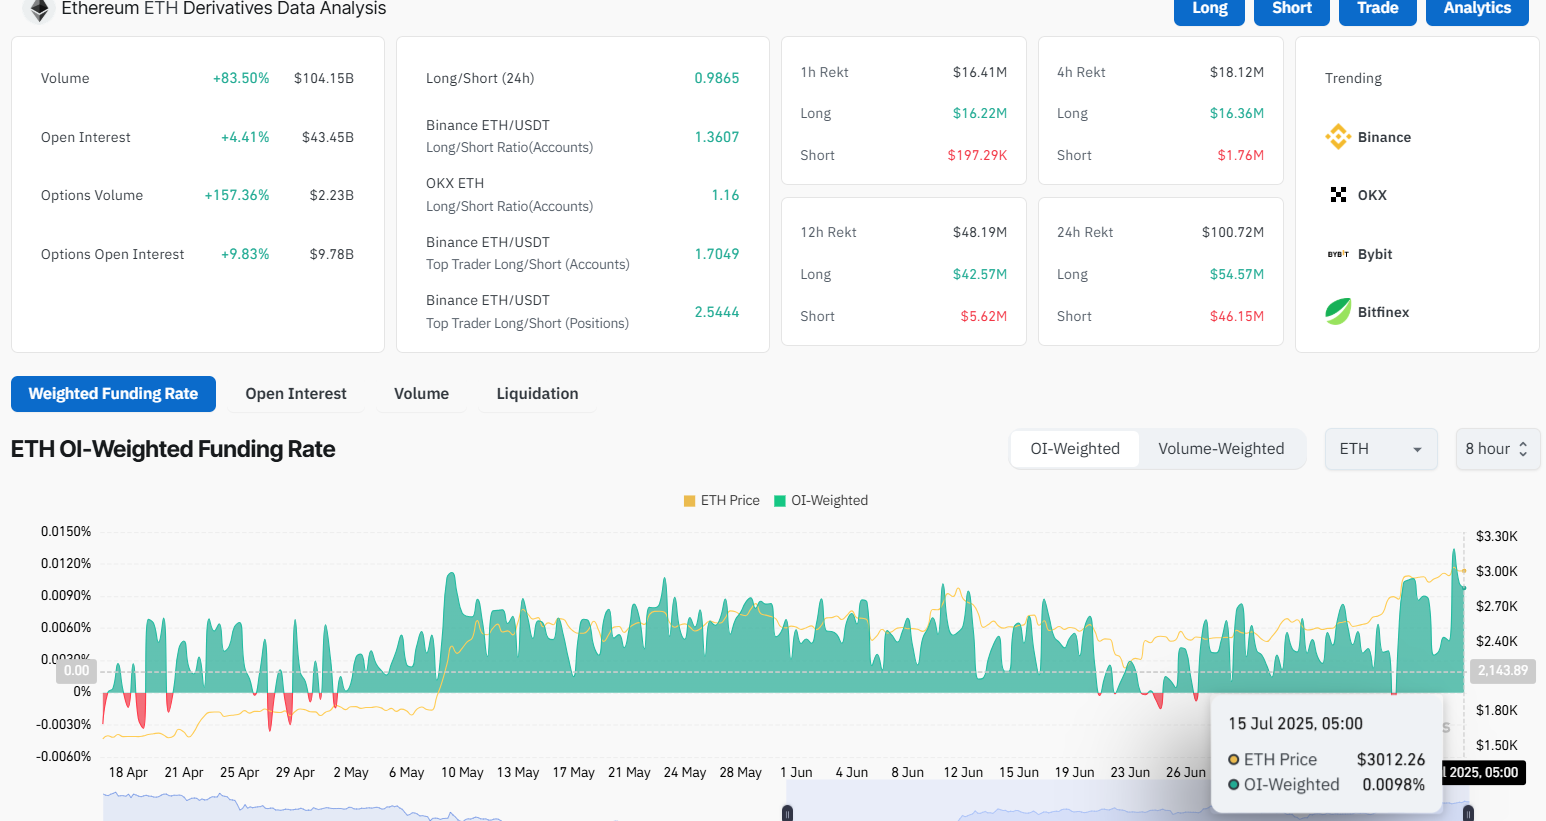
Source: CoinGlass
Michael van de Poppe also mentioned ethereum behavior. He added that the retracement on the ETHBTC pair is to be anticipated. Bitcoin is rapidly gaining altitude. In these kinds of movements, ETH can decelerate. After the stabilization of Bitcoin, ETH would be expected to rise once more. He opines that in the subsequent phase, Ethereum is likely to grow to $3,500.

Source: X
Ethereum Near Overbought Zone
Relative Strength Index (RSI) is a crucial technical indicator that is now at 69.98 in the daily relative strength index (14). This is NEAR the overbought territory. The average line on RSI is now at the value of 62.58. This indicates a healthy trend in the recent sessions. Nevertheless, readings close to 70 are usually followed by minor retracements.
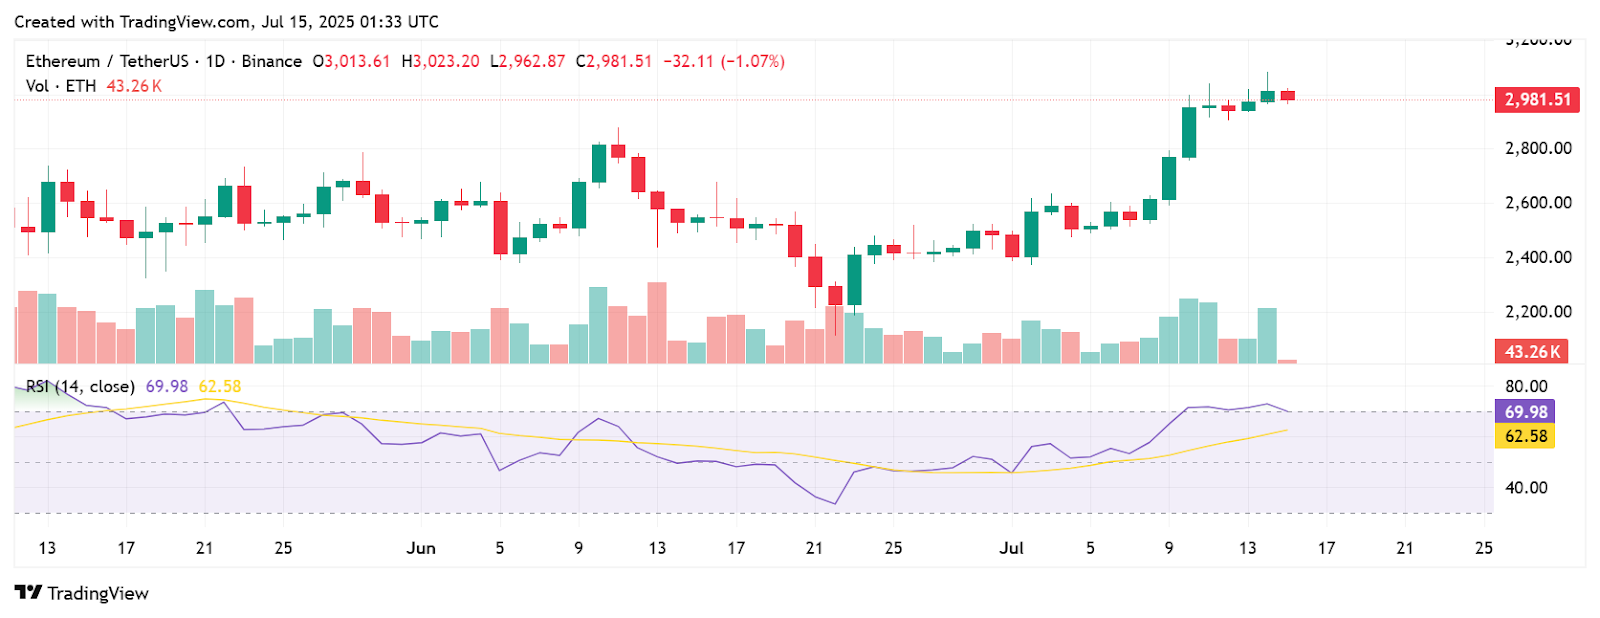
Source: TradingView
Ethereum’s price at the moment is close to the key level of $3,000 resistance. The latter candles indicate indecisiveness. This is occurring following a sharp rally. These levels may be profit-taking levels for traders. A technical healthy drop would be short-term.
Ethereum is on a strong upward trend. However, the historic trends and RSI values indicate that a break will follow. Analysts advise waiting for improved entry points. Another downside or pull back wick would fit the historical trend. Meanwhile, the movement and dynamics of Bitcoin are defining the direction of Ethereum.
: This article is based on real-time market data and general technical observations. It does not constitute financial advice. Always conduct your own research before making investment decisions.
