Stellar (XLM) Primed for Explosive Breakout: 91% Surge Hints at Bullish Frenzy

Stellar's XLM is flashing bullish signals—and traders are taking notice. A 91% rally in recent weeks suggests the asset might be gearing up for a major move.
Could this be the start of a sustained uptrend, or just another crypto pump waiting to deflate? Here's what the charts are screaming.
The Setup: Momentum Builds
XLM has been quietly climbing, dodging the usual crypto volatility. The 91% spike isn’t just noise—it’s a potential breakout in the making.
Why Stellar?
Fast transactions, low fees, and real-world use cases keep XLM relevant. Unlike some tokens that thrive on hype alone, Stellar’s network actually does something—novel concept, right?
The Catch: Timing the Storm
Markets don’t rally forever. If XLM clears key resistance levels, the bulls could run wild. If not? Well, there’s always another ‘next big thing’ in crypto.
One thing’s certain: Stellar’s not fading into obscurity. Whether it’s a moonshot or a fakeout, the action’s just getting started.

- Stellar (XLM) rallies 91% weekly and 18.67% daily, becoming one of the top-performing cryptocurrencies.
- Support level shifts higher to $0.314–$0.376, confirming bullish structure and extended wave (3) trend.
- Open Interest jumps 29.36% to $495.90M, showing strong trader activity and growing market participation.
Stellar (XLM) has registered a strong rally in recent days, rising 18.67% in the last 24 hours, and currently trading at the price of $0.46. Its weekly performance has even been more impressive with the currency gaining 91.39% to place it as one of the best-performing cryptocurrencies in the ongoing market cycle. The trading volume for the same period stands at $14.43 billion, reflecting an 18.13% uptick.
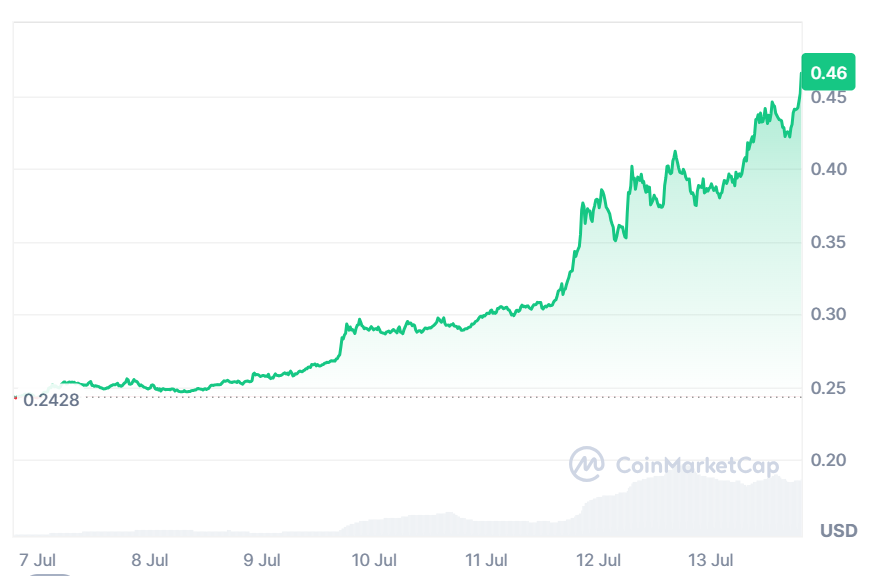
Source: CoinMarketCap
More crypto Online highlighted that the XLM chart is still on its track and no breakout was exhibited. The main support area is now moved to $0.314 up to $0.376. The resistance has been transformed into support by at least this level, and this is a common bullish signal that this rally has a firm foundation. The wave (3) extension seems to be going up, so the uptrend can probably continue.
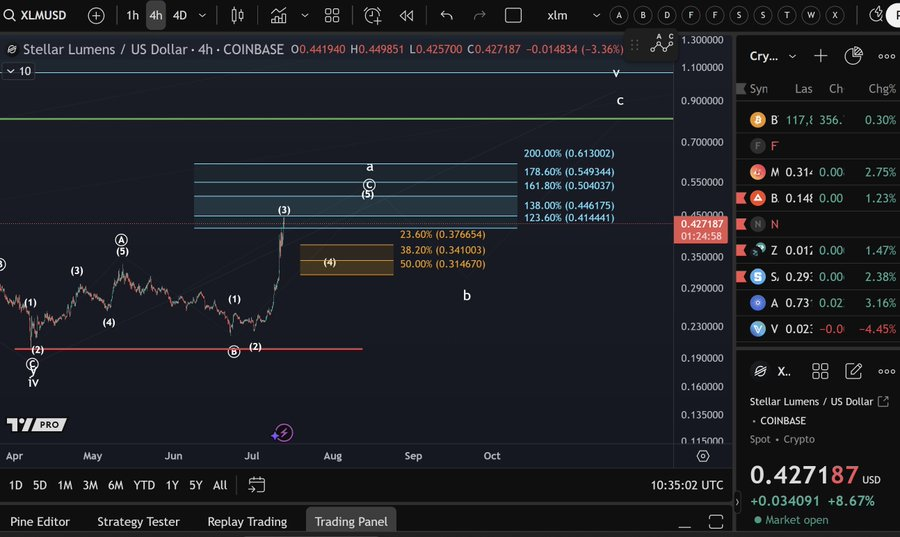
Source: X
Bullish Signals Confirmed
Relative Strength Index (RSI) has reached a top of 89.54. It is well beyond the normal overbought level of 70, which indicates a strong buying pressure. Short-term corrections may follow such levels, but it is also possible to observe them with a staunchly trending market. In the meantime, the RSI has reinforced that bulls are still in control.
The MACD (Moving Average Convergence Divergence) is also adding weight to the present rally. The signal line is at 0.0101 which is much lower than the MACD line, which is at 0.0231, which gives a very strong bullish cross. The increasing histogram bars indicate an increasing momentum, and there are no imminent chances of reversal. Such cross coupled with volume confirmation enhances the likelihood of additional up momentum.
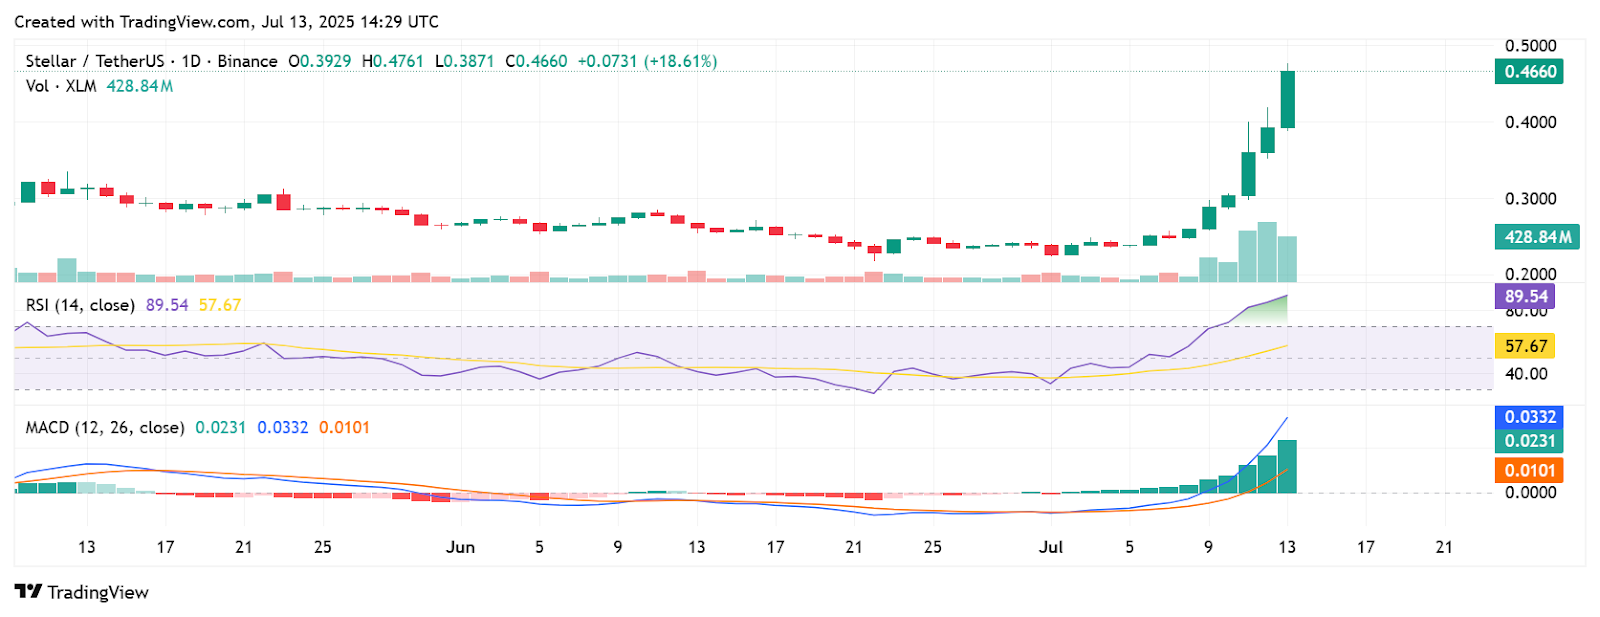
Source: TradingView
Stellar Derivatives Show Strength
According to CoinGlass data, the situation is more bullish but complicated. As volume decreased by 2.27% to a total of $3.81 billion, Open Interest increased to a high extent of 29.36% at $495.90 million. This reflects increased activity levels and good pull in the market. The OI-weighted funding rate is at 0.0064% which indicates good sentiment without any over-leveraging.
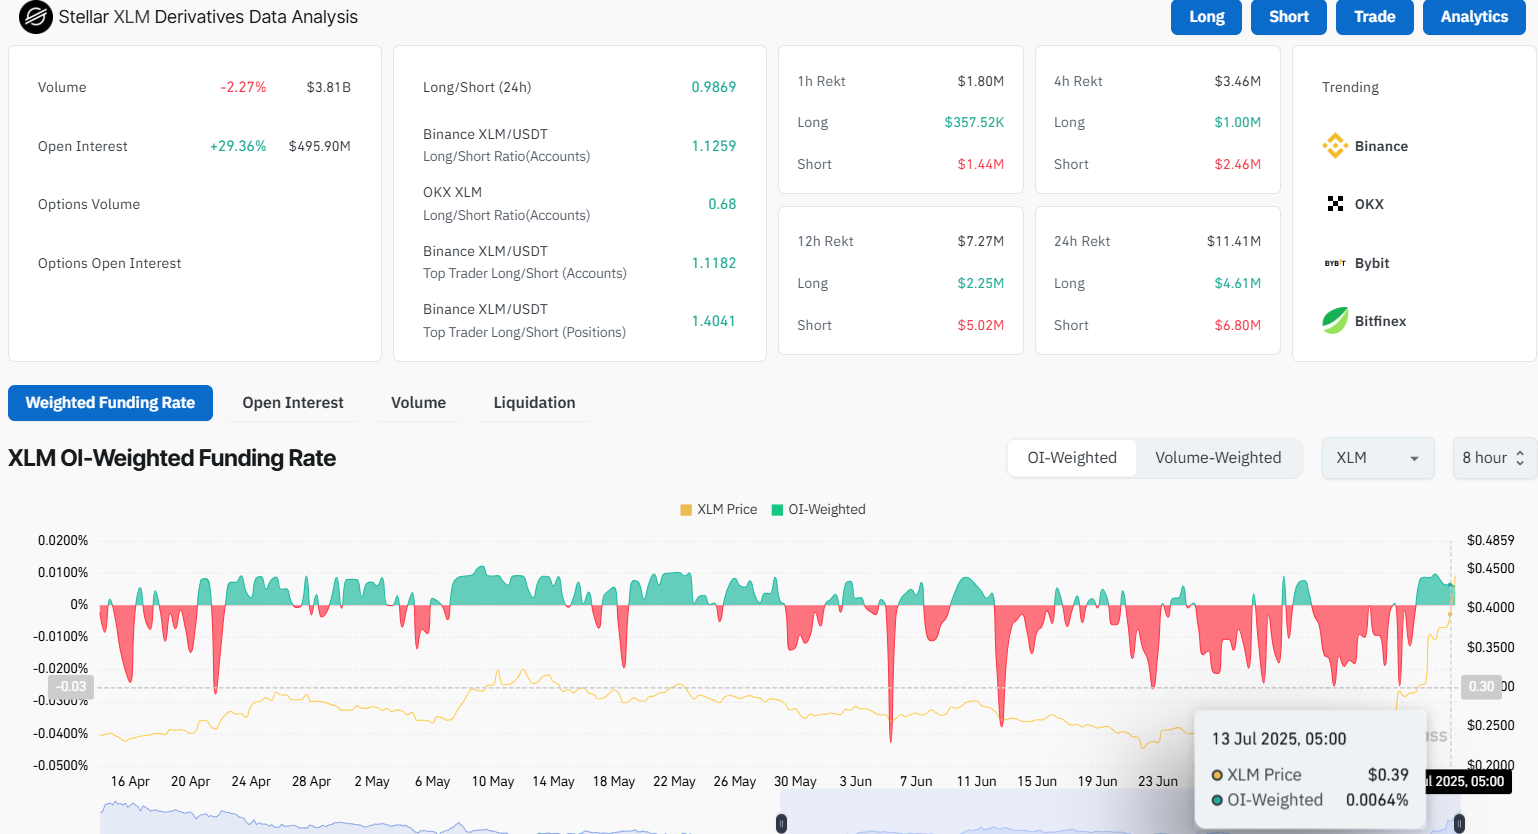
Source: CoinGlass
XForceGlobal revealed that stellar has sustained a very unique nine years of the trend of increasing lows, which is an immensely strong signal of strength and staying power. According to analysts, should this trend persist, XLM may develop a fifth wave or wave C trend as observed in past XRP rallies.

Source: X
The current technical indicators and market involvement support Stellar performance. The combination of increasing RSI, MACD power, increasing Open interest, and long-term support patterns indicates that the increasing trend might be going on. Traders and investors are keenly monitoring Stellar since it may be poised to reach even greater heights during the upcoming sessions.
This article is based on real-time market data and general technical observations. It does not constitute financial advice. Always conduct your own research before making investment decisions.
