Litecoin (LTC) Showdown: Will It Soar Past $86.85 or Plunge Under $84?

Litecoin teeters on the edge—bulls and bears lock horns as the silver crypto faces a make-or-break moment.
Key Levels to Watch
$86.85 isn’t just a number—it’s the line in the sand. Break above, and LTC could ride a fresh wave of FOMO. Crumble below $84? Brace for the 'I told you so' tweets from permabears.
Market Whispers
Traders are split like a fork in Litecoin’s codebase. Some see a replay of 2017’s glory days; others smell a dead-cat bounce. Meanwhile, Bitcoin’s shadow looms large—because when BTC sneezes, altcoins catch pneumonia.
The Bottom Line
This isn’t financial advice, but if history’s any guide, Litecoin will do whatever hurts the most traders simultaneously. Ah, the beautiful efficiency of crypto markets—where ‘price discovery’ is just a fancy term for collective guessing.

- Litecoin stalls at $86, pinned under the 50/100/200-MA triple cap, hinting that bullish momentum keeps fading fast.
- Coinglass shows volume up 9.46% to $541 million, RSI near 45, and long liquidations confirm bears guiding the short-term trend.
- A clean break above $86.85 eyes $90; a slip below $84 could dump LTC toward the deeper $82–$80 support corridor.
On Tuesday, Litecoin (LTC) is under pressure once again, trading at around $86.18 as a result of a relatively low 1.86% decline within the previous four-hour candle. The price action was stuck below three major moving averages, which makes traders quite restless and alludes to possible significant price shifts in the future.
The 50-period simple moving average is currently at $85.51. The 100-day line follows at $86.15, whereas the 200-day ceiling is resisting at $86.85. Over the past three sessions, Litecoin has not managed to finish above that trio. Every rejection lends credence to the opinion that bullish momentum is dwindling rapidly.
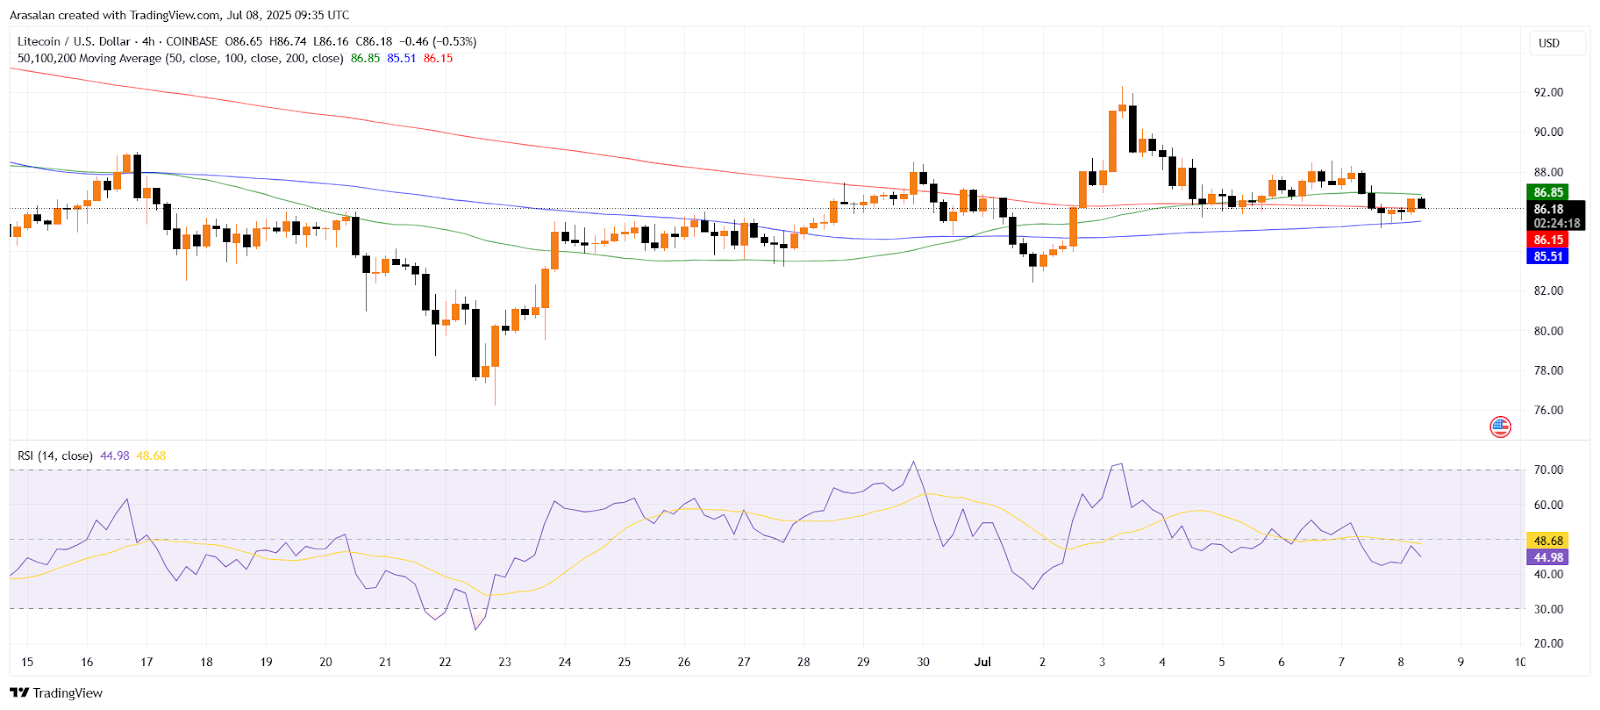
Source: TradingView
Litecoin Faces Bearish Momentum Amid Heavy Turnover
Momentum measures support the warning. The Relative Strength Index has a 14-period value of 44.98. It is trading below its signal line of 48.68, indicating moderate buying pressure and a skewed balance of sellers. CoinGlass data demonstrates a 9.46% increase in volume to $540.97 million, as market players compete to arbitrage.
The open interest ROSE by 0.11%, reaching $609.19 million, with a majority held in perpetual futures. The OI-weighted funding rate is 0.008%, indicating a mild long bias with no evidence of excessive leverage.
Over the past 24 hours, liquidations totaled $631,950, with $623,010 of that amount being a loss on the long side. Shorts have lost only $8,940, which proves once again that the tempo remains in the hands of the bears.
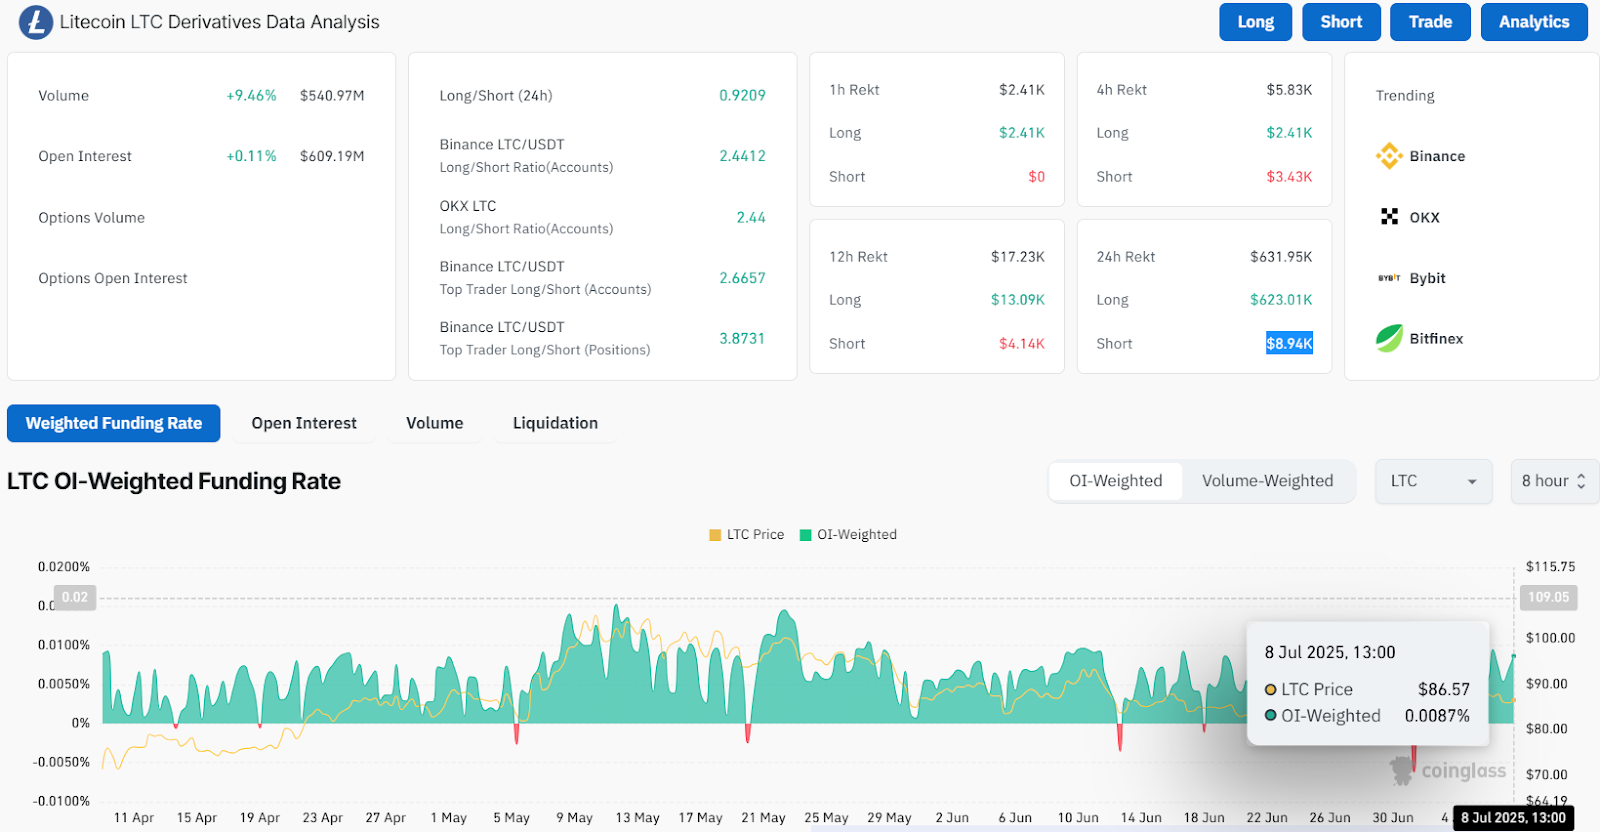
Source: Coinglass
LTC Squeezed Near Key Technical Zones
Market participants are currently betting on the key support and resistance levels on Litecoin. There is the 200-period moving average at $86.85 in the form of immediate resistance. The close above it may draw a rapid run to the high of early July at $90 and possibly even to the highs last month of nearly $92. Breakout buyers, however, will desire volume to confirm the MOVE and avoid being caught in another bull trap.
On the negative front, first-line support is at $84, where the price rebounded towards the end of last week. Beneath that, a trendline has been in place since the end of June, sloping downwards to merge with the $82 handle, forming a deeper cluster of Litecoin support and resistance areas. A clear breakdown at $82 threatens to engulf the losses, extending to $80 and potentially retesting the swing low of May at around $77.
On July 3, Litecoin broke through the $90 mark but lost its gains in a matter of hours. Since then, lower highs and lower lows have developed, creating a shallow descending channel in the four-hour chart. Analysts believe that selling will remain a tactical advantage until that trend is reversed.
Another twist on the side is the presence of macro signals. Bitcoin dominance is on the increase and is bleeding capital to mid-cap coins like Litecoin. LTC could not easily decouple from the rest of the market lethargy unless there are headline catalysts that turn the risk sentiment.
Litecoin is moving in a tight squeeze. A convincing candle surpassing the $86.85 level turns the chart bullish; a slip below $84 gives ascendancy to bearish moods. The increasing size is a sign that the range is due to break, and traders monitor these pivot points as the catalyst.
