Solana’s Epic Comeback: Can It Smash Through $160 and Keep Rallying?

Solana’s making moves—again. After months of sideways action, the blockchain’s native token is staging a fierce rebound. Traders are buzzing: will this surge crack $160 and leave skeptics in the dust?
Here’s the playbook. Solana’s tech—once dogged by outages—now flaunts upgrades that could silence the haters. Network speeds? Blistering. Developer activity? Surging. The usual crypto volatility? Still very much present, because some things never change.
But let’s talk price. Breaking $160 isn’t just a psychological win—it’s a gateway to retesting all-time highs. Of course, Wall Street’s crypto tourists will call it ‘irrational exuberance’ right up until they FOMO in. Classic.
Bottom line: Solana’s got momentum. Whether it’s enough to punch through resistance—and stay there—depends on whether the network can keep delivering while the rest of the market plays hot potato with hype cycles.

- Solana’s price drops by 2.65% to $148, but trading volume surges 36.79%, reaching $3.7 billion.
- Support levels are at $140 and $125, while resistance is expected between $160 and $180 for Solana.
- A breakout from a symmetrical triangle could push Solana’s price towards targets of $179, $205, and $265.
As of press time, solana is trading at $148, showing a 2.65% decline over the past day. The trading volume for the same period stands at $3.7 billion, reflecting a 36.79% increase. Over the past seven days, the Solana coin has dropped by 4.67%.
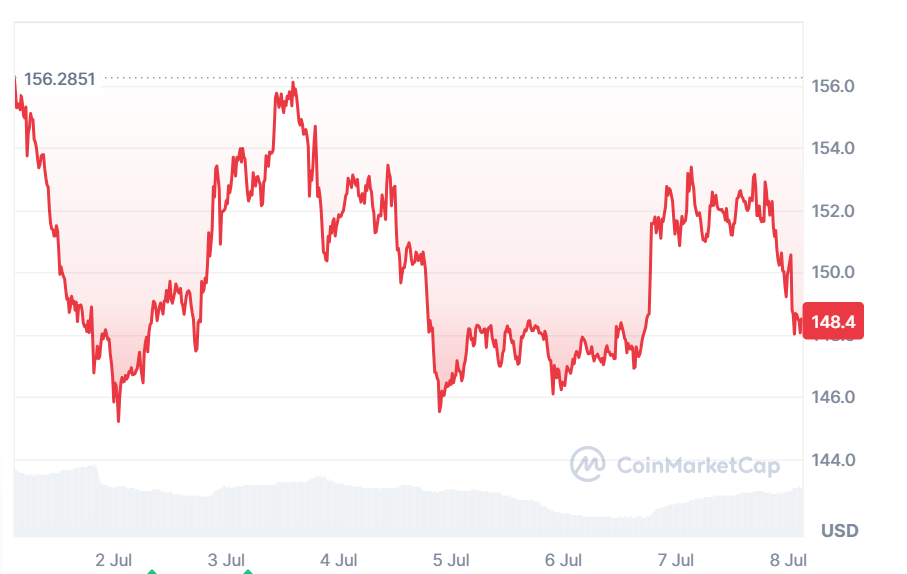
Source: CoinMarketCap
CoinCodeCap Trading revealed that Solana has been unsuccessfully trying to break a Channel Down, which is a possible indicator of a market change in direction. Nonetheless, the breakout is yet to be determined as the wider market is still experiencing a downtrend. The new price action has attracted buyers.
Crucial Support Levels
The Solana price target is set at $160 to $167, showing a possible upside of 10%. It is advised to have a stop-loss at $136 which is slightly beneath the foundation of the breakout, to reduce the level of loss. The crucial support areas of the cryptocurrency are $140 and $125.
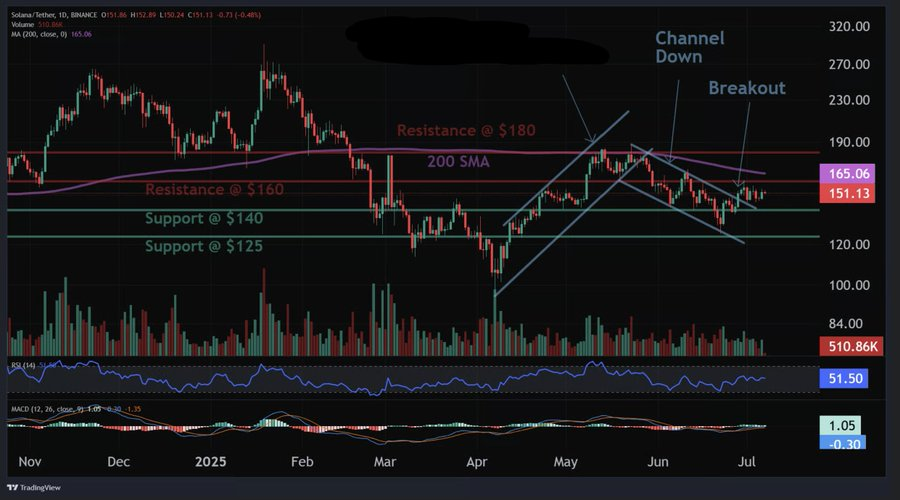
Source: X
These levels will play significant roles in setting the future direction of the price. Conversely, there will be resistance between $160 and $180. The short-term trend is bullish, whereas medium- and long-term trends have bearish indicators. However, speculation in ETFs may trigger a short-term rally, providing traders with a possible entry point.
According to Jonathan Carter, Solana is attempting to test the upper resistance line of a symmetrical triangle structure on its daily time frame. The price is also close to crossing the 50-day moving average, which may serve as resistance. In case of a successful breakout, there may be targets up to $179, $205, $224, or even $265.
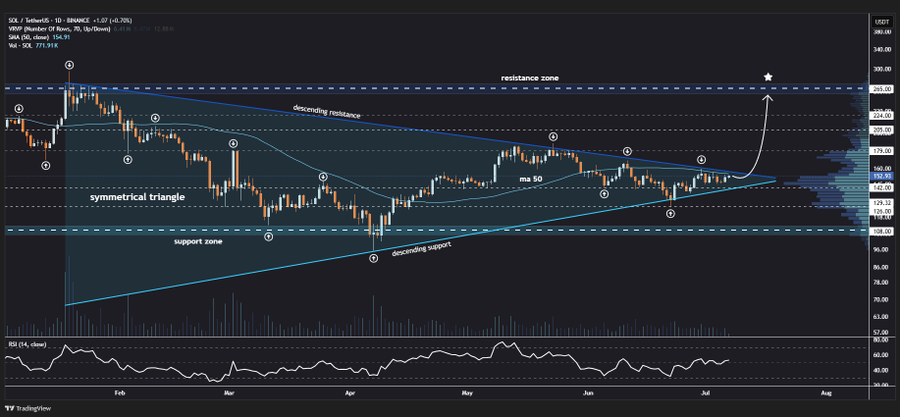
Source: X
Solana Market Sentiment
Solana Relative Strength Index (RSI) stands at 48.65. The RSI plays an enormous role in giving market sentiment. The market is neutral with the current reading. The level exceeding 50 may indicate increasing bullish sentiment, and the level falling below 30 may be a point of further bearish pressure.
SOL is given a mixed outlook by Moving Average Convergence Divergence (MACD). The MACD line stands at 0.86 and the signal line is captured at -0.54. This gives a minor bullish crossover, indicating a short-term rise in momentum. However, the -1.40 total MACD shows that the market is still under bearish pressure.
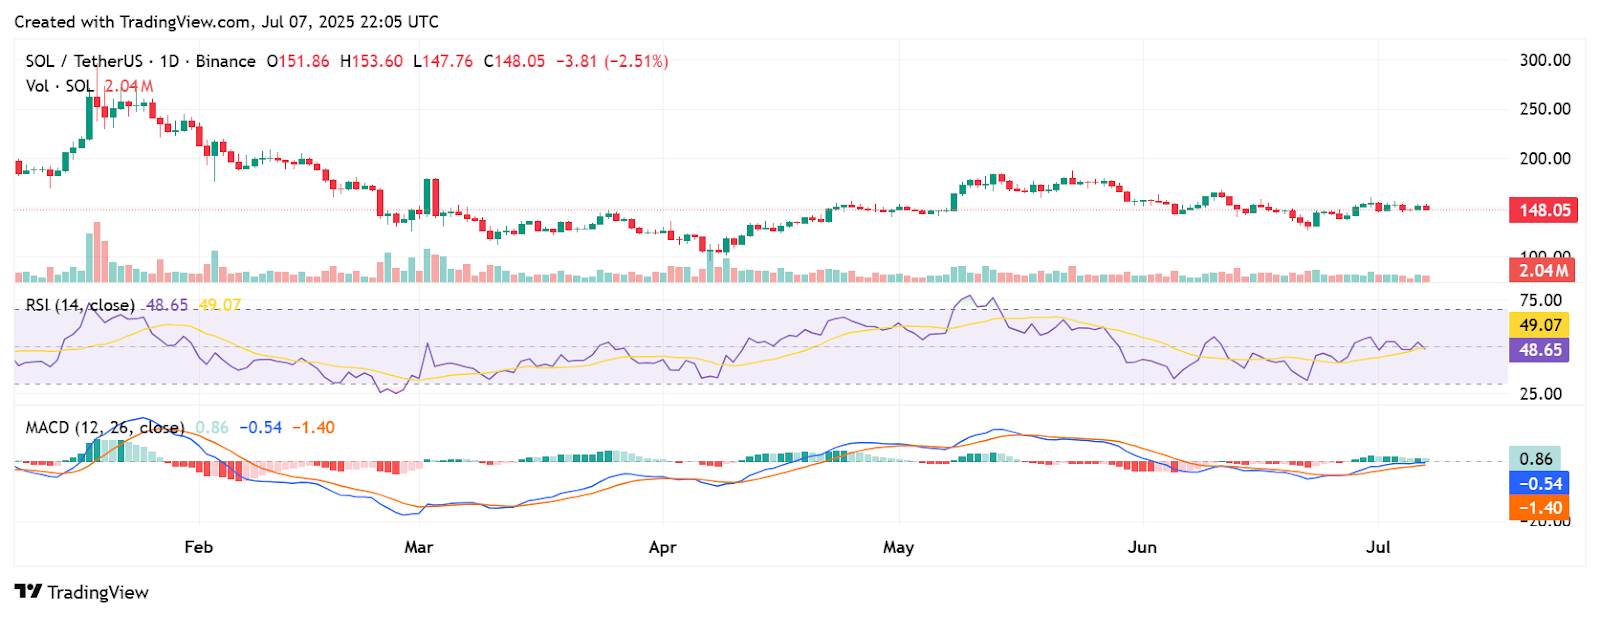
Source: TradingView
SOL is in a critical stage. Although it has decreased a bit in the short term, a breakout signal will likely indicate a reversal of a trend. The coming days will play a critical role in the decision of the next MOVE for SOL.
