Bitcoin Primed for Breakout as Bull Flag Signals Potential New All-Time Highs

Bitcoin's chart flashes a classic bullish signal—just as Wall Street 'discovers' crypto again (right on schedule).
The Setup: A textbook bull flag pattern emerges after BTC's recent 30% rally, suggesting institutional accumulation beneath the surface.
Why It Matters: These consolidation phases typically precede explosive moves. The last time this formation appeared, Bitcoin ripped 150% in three months.
Watch the Neckline: A daily close above $72,000 converts technical theory into price reality—and probably triggers another round of 'digital gold' think pieces from banks that called it a scam in 2022.
Bottom Line: Markets move when leverage flushes out and skeptics turn believers. With shorts building and open interest rising, Bitcoin's coiled for its next big play—whether traditional finance is ready or not.

- Bitcoin forms a bull flag pattern, hinting at a potential breakout toward new highs.
- Price consolidates above key moving averages, building bullish market momentum.
- A breakout above resistance could trigger a volume spike and renewed buying pressure.
Bitcoin (BTC) has been demonstrating a technical pattern that is likely to prompt its next significant direction. A new analysis by Alpha crypto Signal shows that a bullish trend is coming based on the daily chart. This trend is known by traders as a bull flag. It is a common pattern preceding powerful price rallies, and currently, BTC is just below an important breakout level.
Bitcoin Nears Bull Flag Breakout
Source: X
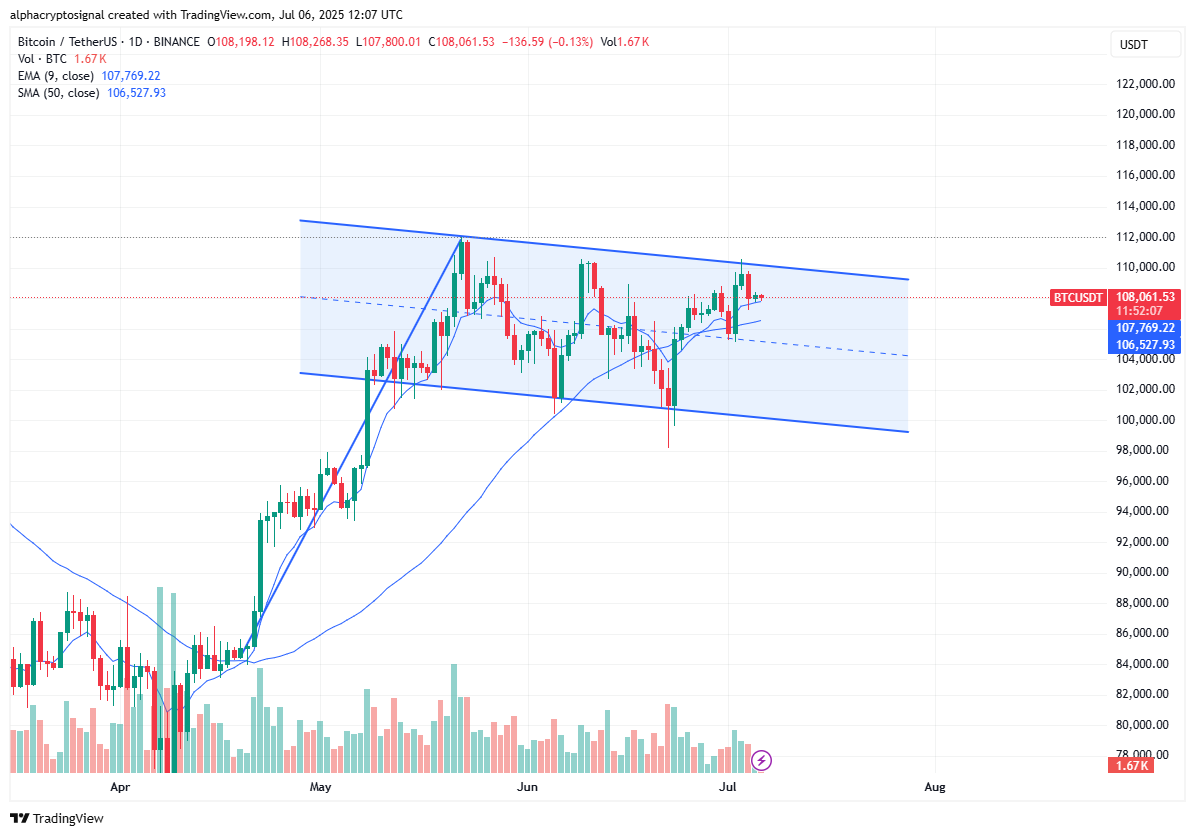
The chart shows Bitcoin trading inside a sloping channel since early May, with its price steadily bouncing between the top and bottom lines. Recently, it has moved back to the upper part of this range, just under the flag’s top trendline.
Meanwhile, the price is above two important moving averages (the 9-day EMA and the 50-day SMA), which traders use to determine momentum. Such a position indicates an increasing possibility of moving upwards.
At a price of approximately $108,000, it’s just below the top of the bull flag. A close above this line with solid trading volume could trigger a strong upward move. The analyst notes this type of breakout would likely kick off a new rally, possibly toward a new all-time high. This occurs as most investors observe the market, waiting to determine when bitcoin will advance again.
A New Uptrend Could Start After The Breakout
Mining rewards declined after the halving event in April 2024 and decreased the rate at which new coins were created. Hence, the focus now is on market structure and the sentiment of investors. The chart indicates that Optimism is building up as its price remains above significant moving averages and consolidates around resistance levels.
The bull flag pattern is normally a continuation pattern, and as such, it follows a strong up-move and rests before the next up-move. If Bitcoin breaches this flag, it may regain its longer-term uptrend. The last time the crypto asset displayed the same configuration, its price ROSE by thousands of dollars within weeks.
Bulls have an advantage because the price is consolidating closely below resistance but above moving averages. This is what many traders want to see before taking positions.
Once Bitcoin breaks out of this flag, traders can expect a spike in volume. In addition, it may even lead to more buying momentum during the rally.
