Ethereum’s Bullish Surge: Can It Defend the $2,430 Fortress?

Ethereum isn’t just holding—it’s flexing. The $2,430 level isn’t a pitstop; it’s a battleground where bulls and bears throw down. Forget 'support'—this is a stress test for the entire crypto market’s confidence.
Why $2,430 matters more than your banker’s golf handicap
Break below this, and the 'ETH to $10k' crowd starts sweating. Hold above? The shorts get squeezed harder than a Wall Street intern during earnings season. Liquidity’s thin, volatility’s jacked, and the charts look like a caffeine overdose.
The real question isn’t technical—it’s psychological. Traders are watching this price like hawks (or like VC tourists watching a Bitcoin chart). One thing’s certain: Ethereum doesn’t do quiet exits.

- Ethereum breaks resistance at $2,516, pointing to an uptrend with targets at $2,760 and $3,000.
- RSI at 51.95 suggests a neutral market; a drop below 48.60 could signal weakening momentum.
- Spot ETF staking in 2025 could boost Ethereum, with support levels at $2,400 and $2,100.
Ethereum is trading at $2,514, representing a modest 0.18% increase over the past 24 hours. The trading volume for the same period stands at $12.16 billion, showing an 18.54% downtick. ethereum price has increased by 3.7% over the last week.
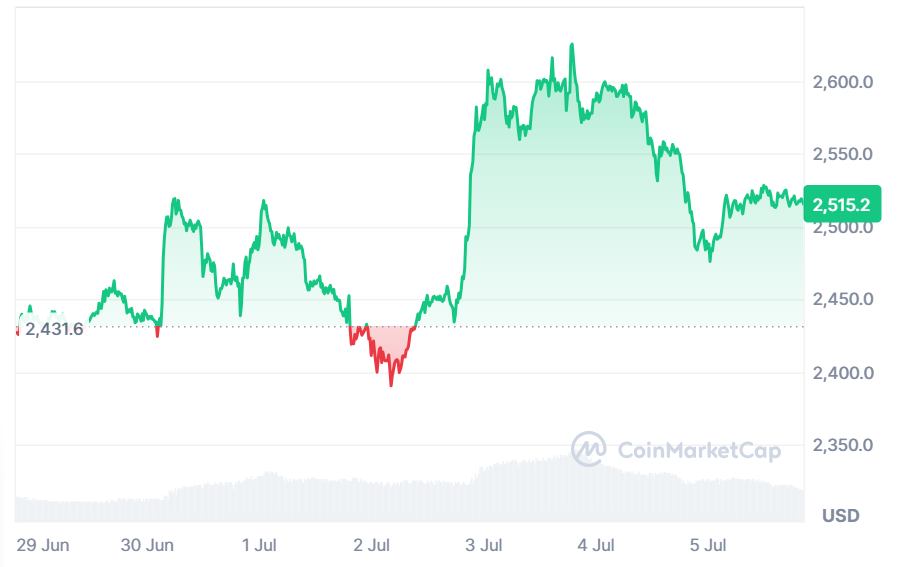
Source: CoinMarketCap
CoinCodeCap Trading highlighted that the new price action recorded by ethereum involved the coin surpassing its 200-day moving average (MA), which is pegged at a price of $2,516. This important level of resistance was broken, indicating a possible uptrend. The analysts suggest that this will bring Ethereum closer to the $2,760 range, which is around $ 3,000. The most important factor in the short-term prospects of Ethereum will be its capacity to sustain this bull run.
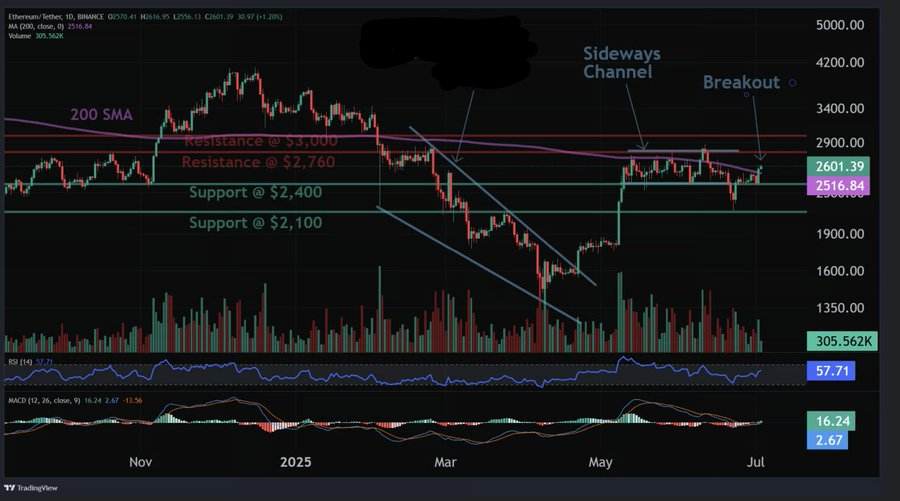
Source: X
Ethereum Bullish Momentum
The motion of Ethereum prices indicates another bullish trend. ETH price may go even higher because of the anticipated launch of Spot ETF staking in 2025. Currently, the next price levels for ETH are $2,760 and $3,000, with support levels at $2,400 and $2,100.
ETH is experiencing mixed short and medium-term trend signals. The short-term indicators show the trend to be on the increase, though the medium-term signals are bearish. The long-term views are still optimistic, and additional profits can be speculated in case ETH holds its current levels above the support.
The Relative Strength Index value is 51.95. This market is at a neutral point, indicating that ETH is neither overbought nor oversold. The RSI indicates that it has a greater chance of moving lower, yet when it falls below 48.60, it may reflect that the trend is slowing down.
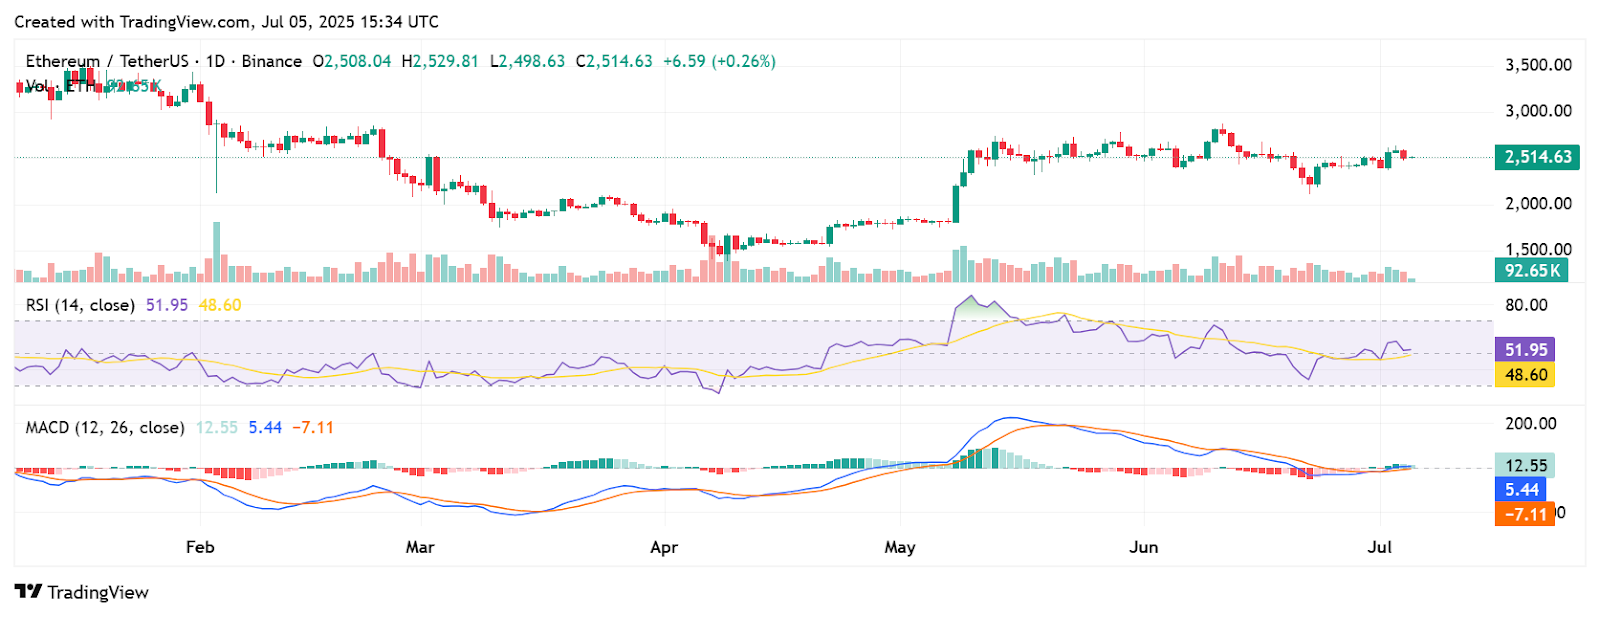
Source: TradingView
MACD Shows Mixed Signals
Moving Average Convergence Divergence (MACD) has conflicting signals. The MACD line is 12.55 compared to the signal line 5.44. The histogram is at -7.11, which shows negative momentum. The weak histogram indicates that the strong MACD line has to be taken with caution. The price of ETH remains weak, and traders will require additional assurance to take long positions.
Analyst DD revealed that the accumulation zone is developing under local range highs. They are anticipating confirmations that the demand region around the level of $2,430 is holding. If ETH remains above this price, it could rise to the target price of $2800. However, in the event that the price drops below $2,430, swing longs might be an alternative. The most important thing is patience as the market structure evolves.

Source: X
