Cardano (ADA) Breaks Out: Bullish Broadening Wedge Signals $1.30 Target

Cardano's ADA isn't asking permission—it's carving a path toward $1.30 with a textbook broadening wedge formation. Here's why traders are flipping bullish.
The pattern: A volatility megaphone
Unlike tight consolidations that bore traders to tears, ADA's expanding price range screams accumulation. Each higher high and lower low builds pressure like a coiled spring—classic broadening wedge behavior.
Target locked: $1.30 or bust
The measured move suggests a 30% upside from current levels. Of course, in crypto-land, 'measured moves' are about as reliable as a Wall Street analyst's price target—but the momentum doesn't lie.
Ouroboros vs. the bears
Cardano's proof-of-stake protocol keeps humming while other chains drown in gas fees. Maybe the 'academic approach' isn't so impractical after all—unless you're a maximalist who thinks every blockchain needs to waste energy to prove its worth.
Watch the breakout volume
Clean breaks on high volume could confirm the pattern. Anything less? Just another fakeout in the casino that never closes.

- ADA is in a bullish wedge pattern that has an increasing technical momentum.
- There is a potential breakout on the ADA daily chart depicted by the MACD crossover.
- ADA’s price targets are between $0.80-$1.30 should it be above the MA 50.
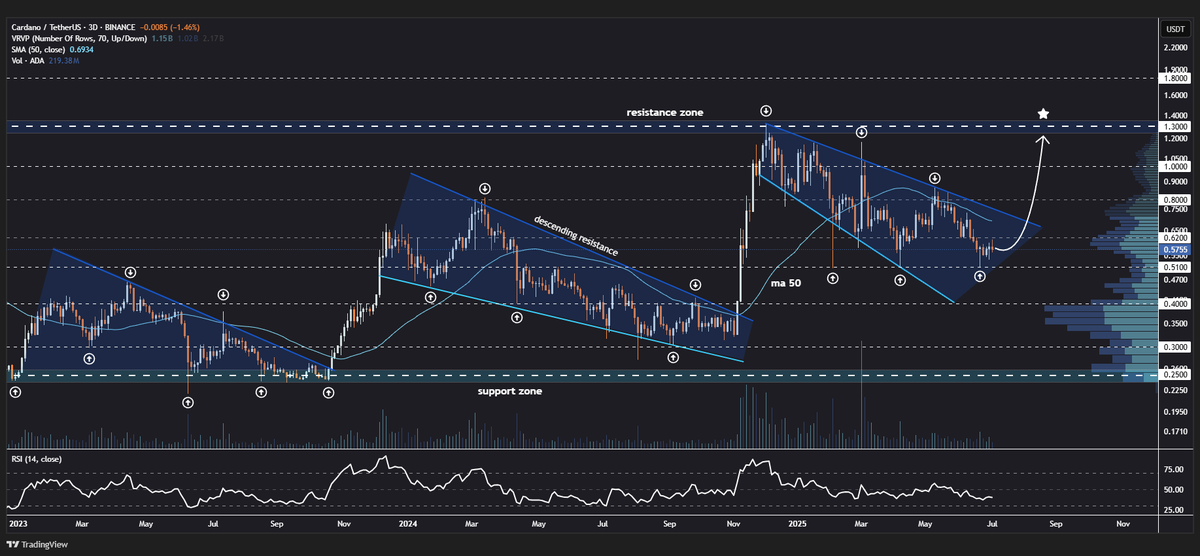
Cardano (ADA) is one of the coins that has been rising recently. It is currently forming a broadening wedge type of pattern on its 3-day chart as per analyst Jonathan Carter.
He cited that this marks the third consecutive bullish position on ADA, as it is getting technically more powerful. A broadening wedge normally implies that price swings are becoming broader and may bring about a breakout.
Cardano Chart Shows Bullish Setup as Volume and Support Levels Grow
Carter further said that as long as Cardano trades above the 50-day moving average, it might initiate an extended rally. The price, he thinks, will climb to $0.80 then towards $1.00, or likely to go all the way up towards $1.30.
The chart that he provided reveals the zone of resistance between $1.00 and $1.30. It also shows a potential price direction that will drive Cardano’s price into the resistance zone when a breakout occurs. The pattern also brings to light earlier occurrences of bullish wedge breakouts causing price surges in the last one year.
Source: X
The bottom area at around $0.35 has managed to support this pattern on several occasions, thus reinforcing the present bullish sentiment. There is also a volume buildup visible on the chart around the $0.50 region which may eventually become a launchpad.
MACD Shift Seen as Early Signal of Price Recovery
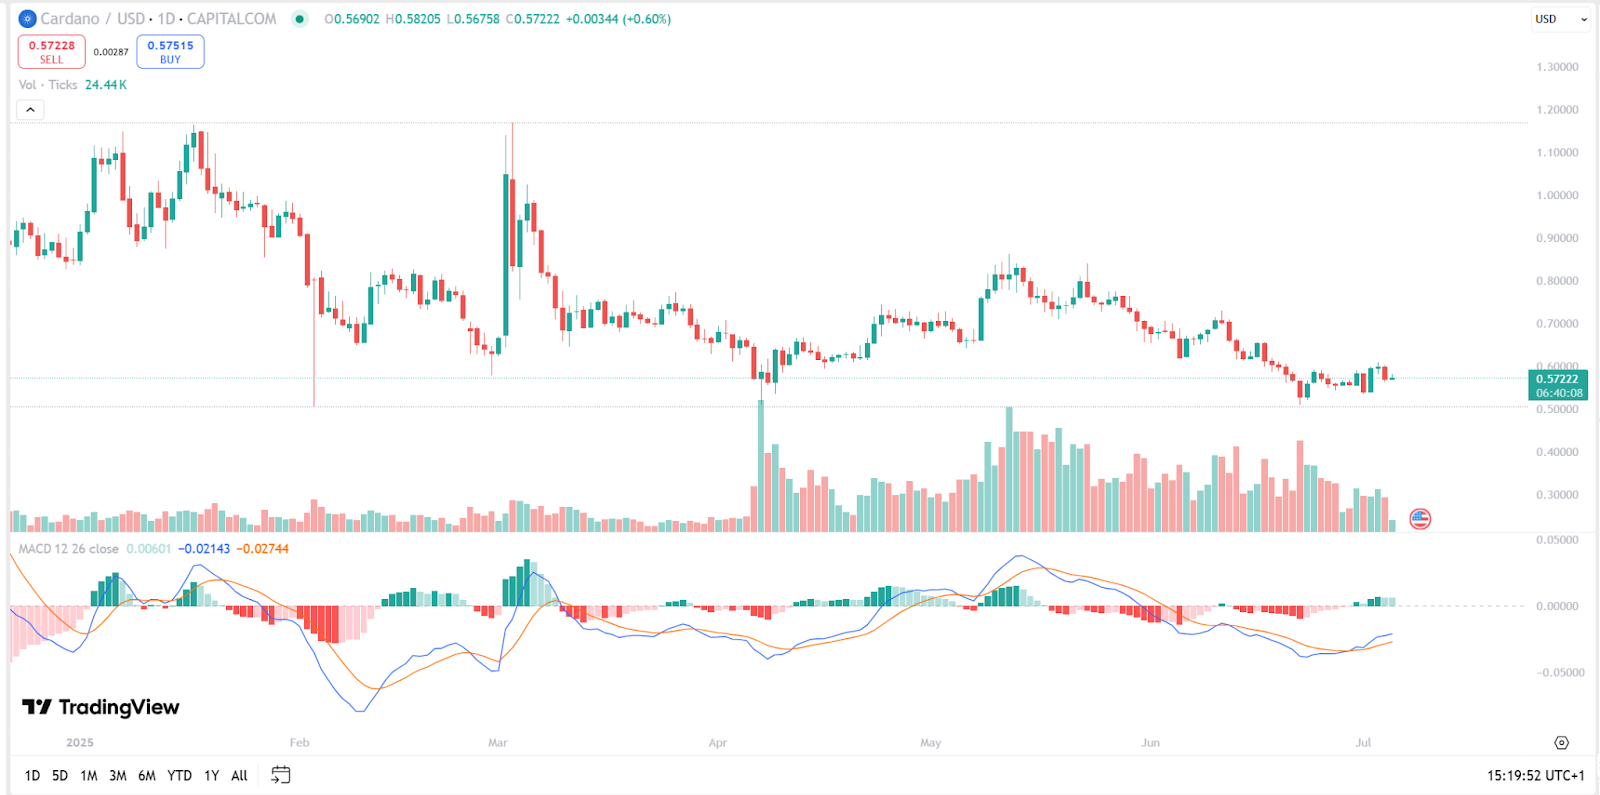
In the meantime, a daily chart provided by TradingView indicates that ADA is trading with minor upsides of 0.60 percent. The chart indicates that it has been moving sideways over a long span of time. However, in recent history the price has been presenting tiny green candles, indicating buyers are entering the picture.
Source: TradingView
Looking at the MACD indicator at the bottom of the chart, the blue line is intersecting above the orange one. This is usually interpreted as an indication that it is gaining positive impetus.
The MACD is still zero-negative, but it is evidently turning more on the positive side. This contributes another reason to believe that ADA could be prepared to break out in the NEAR future.
Cardano has also begun to rise in trading volume, and it means traders are returning to ADA. ADA may turn around soon as long as the purchasing pressure persists and the price breaks higher than the 50-day average. According to Carter, however, it must take out above major support, as well as confirm the breakout before the rally can start.
| cardano Holds Steady Support As $0.61 Milestone Fuels Bullish Outlook
