BNB’s Bullish Surge: Is $700 the Next Stop in Its Rally?

BNB isn't just climbing—it's mooning. The token's relentless uptrend has traders whispering about a potential assault on the $700 threshold. Here's why the momentum might not be slowing down.
Technical Tailwinds Fueling the Rally
Breaking past resistance levels like they're made of wet tissue paper, BNB's chart paints a textbook bullish narrative. Each pullback gets swallowed by fresh buying—classic FOMO behavior.
The Institutional Whisper Factor
While retail traders chase the pump, cold-eyed whales are accumulating. Rumor has it three Asian hedge funds quietly repositioned 15% of their crypto portfolios into BNB last week. Nothing moves markets like herd mentality with deep pockets.
Exchange Ecosystem Growth
Binance's relentless expansion—new fiat gateways, derivatives products, even a foray into tokenized stocks—keeps pouring rocket fuel on BNB's utility case. Love 'em or hate 'em, their execution is brutal efficiency.
Will $700 Hold Psychological Weight?
Round numbers attract profit-taking like moths to a flame. If BNB punches through $700, the next real resistance might not appear until the four-digit club. But let's be real—in crypto, 'resistance levels' are just places where leverage traders get liquidated.
Closing Thought: Another day, another crypto asset defying gravity while traditional finance dinosaurs mutter about 'valuation metrics.' As if they'd know disruptive potential if it bit them in their 10-K filings.

- BNB breaks above $642, signaling a bullish trend, next target is $700, with a recommended stop loss at $637.
- RSI at 55.19 indicates room for growth, suggesting that bullish momentum will likely continue for BNB.
- Trading volume down 7.59%, but stable open interest suggests medium bullish strength and continued upward movement.
BNB is currently trading at $660, a decline of 0.41% in the last 24 hours. The trading volume of the same period is at $1.45 billion, showing a decrease of 7.59%. The BNB coin has gained 2.16% over the past seven days.
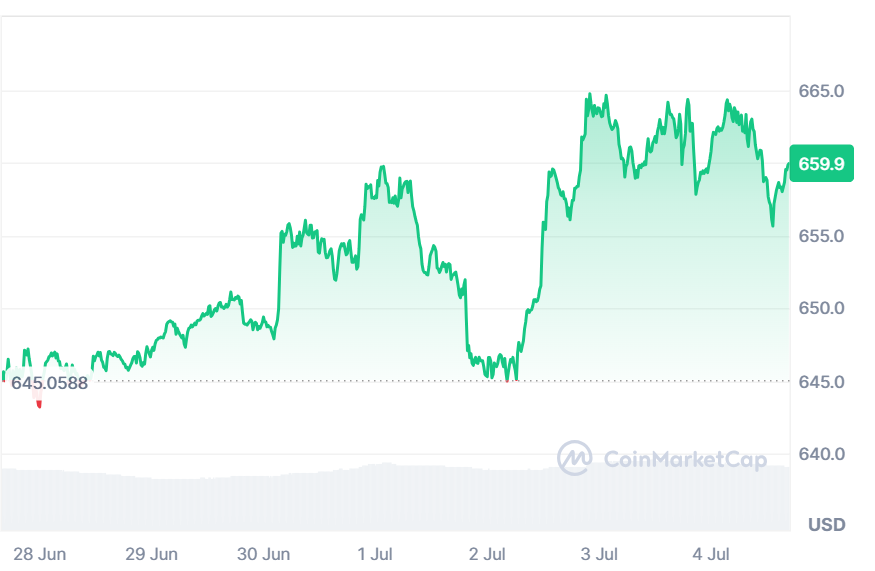
Source: CoinMarketCap
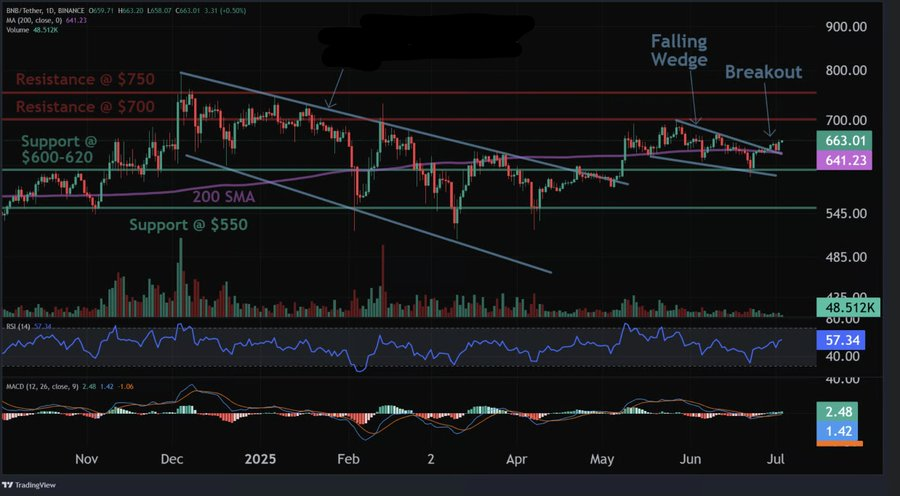
CoinCodeCap highlighted that BNB has surged above the 200 Simple Moving Average (SMA) at $642. This breakout is an indication of a powerful bullish market. The next price that BNB targets is $700. The recommended stop loss WOULD be $637. The trend is generally bullish, which makes BNB one of the best options to use as a swing trade in the present market.
Source: X
Bullish Falling Wedge Formation
A falling wedge pattern of the breakout, which is normally bullish. The short-term support levels are observed at $620 and $550, whereas the resistance will be observed at around $700 and $750. If BNB is able to overcome these resistance levels, the price may rise even further. More crypto Online disclosed that BNB might increase to a maximum of $816, given that the market is headed towards an upward trend. The trend is highly positive over the short, medium, and long terms.
Source: X
Also Read: BNB price Breakout: Is $700 the Next Target for Binance Coin?
According to CoinGlass data, there is a minor decline in volume. The trading volume decreased by 8.86% to $454.22 million. Open interest, however, has remained unchanged, decreasing by only 0.04% to $756.49 million. The OI-weighted rate of funding BNB is 0.0040%. This indicates a medium strength of bullishness by traders. The technical indicators of the token are strong despite the volume decline, which indicates that this coin has more room to grow.
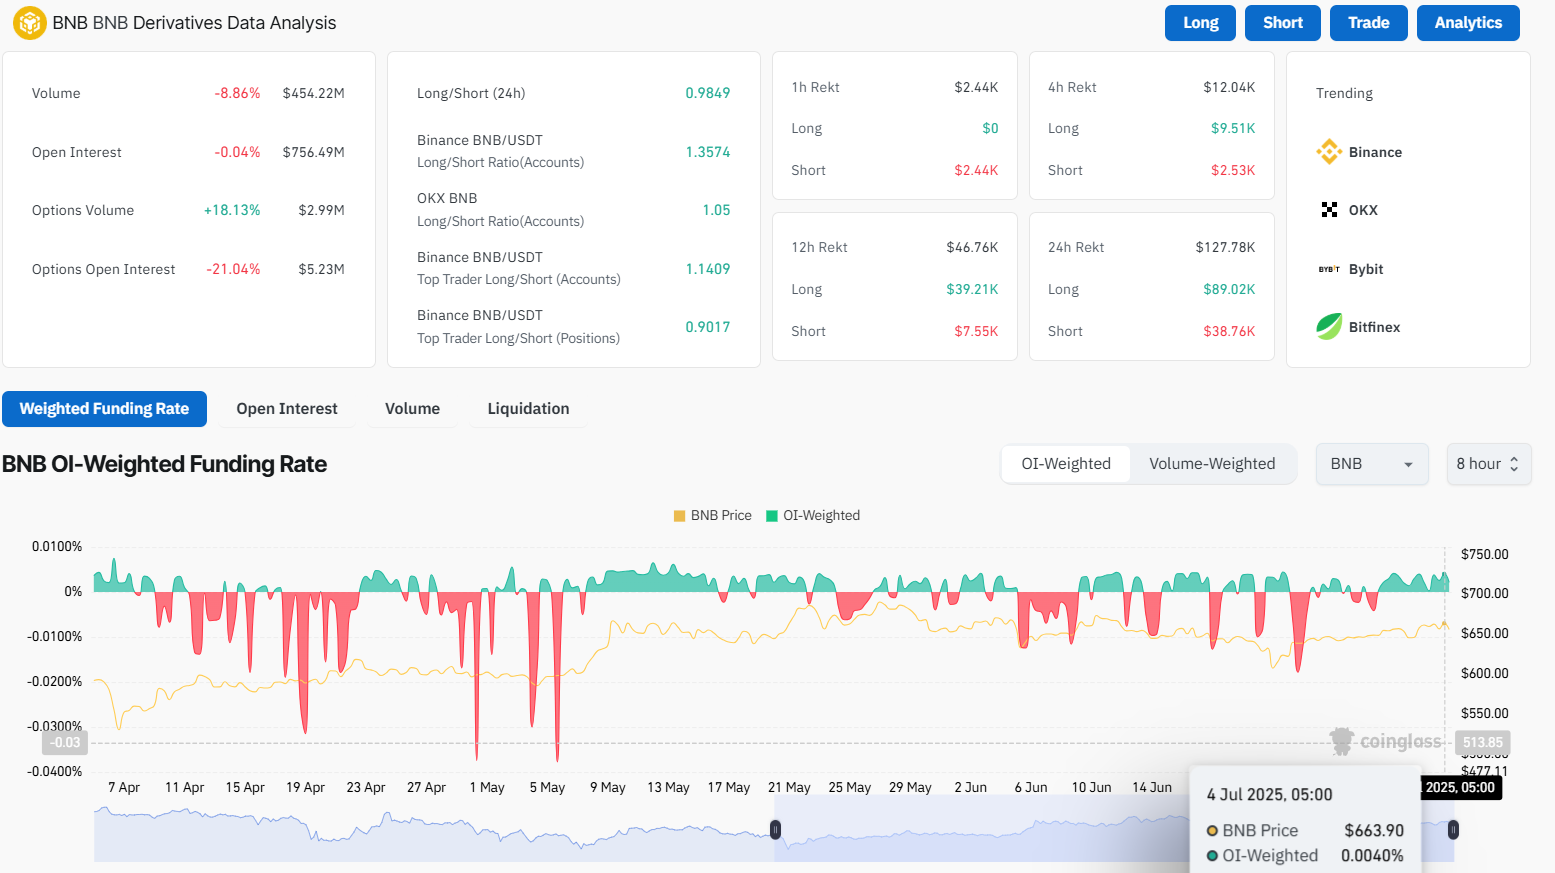
Source: CoinGlass
BNB RSI Shows Bullish Momentum
The token Relative Strength Index (RSI) stands at 55.19. This implies that the coin is not overbought or oversold. A value of more than 50 is an indication that an uptrend may persist. As long as RSI remains high above 50, the trend will be favorable. The RSI is currently at a level that suggests the possibility to grow, and the coin is not in the overbought zone. This favors the argument of the bullish momentum.
A bullish momentum is also confirmed by the Moving Average Convergence Divergence (MACD). The MACD line is 2.46 and is above the signal line 2.02. This crossover indicates a bullish outlook in prices. The MACD histogram remains positive at -0.44. It shows that the trend of cryptocurrency is strong and could be expected further.
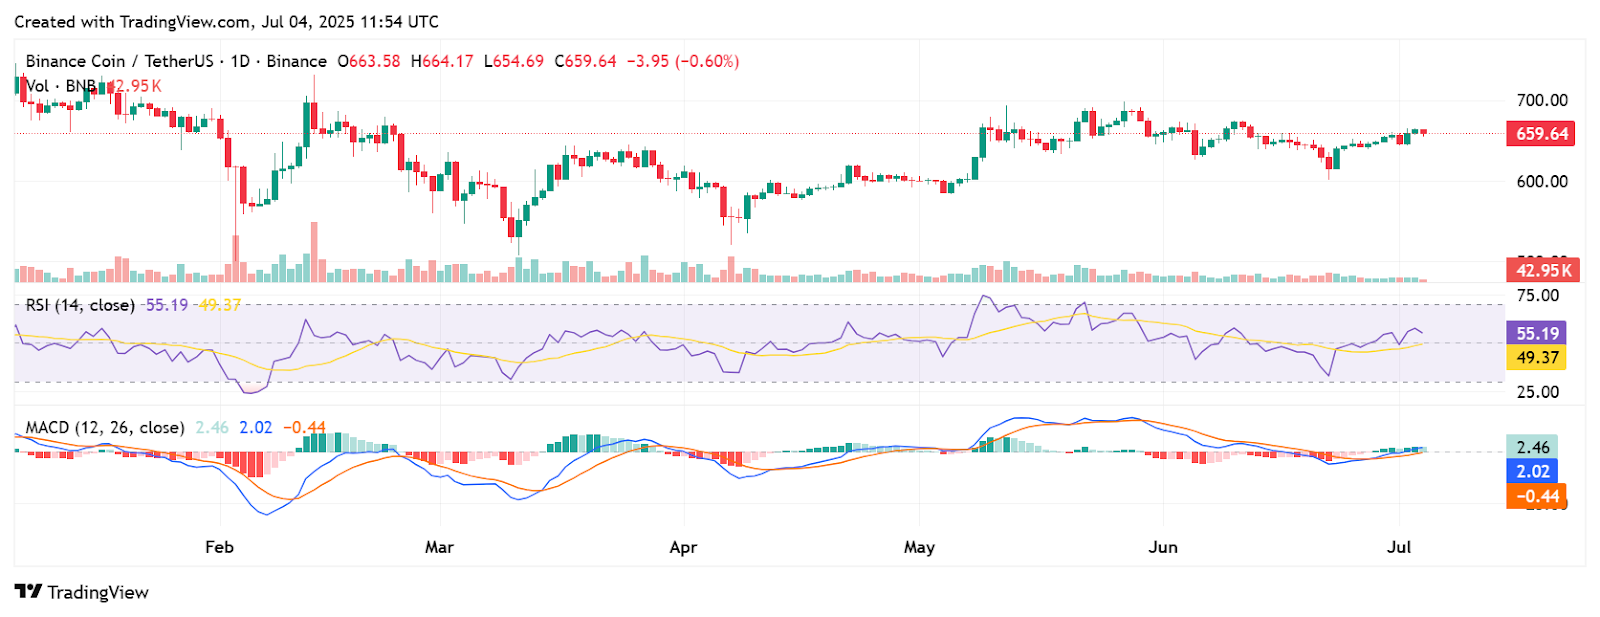
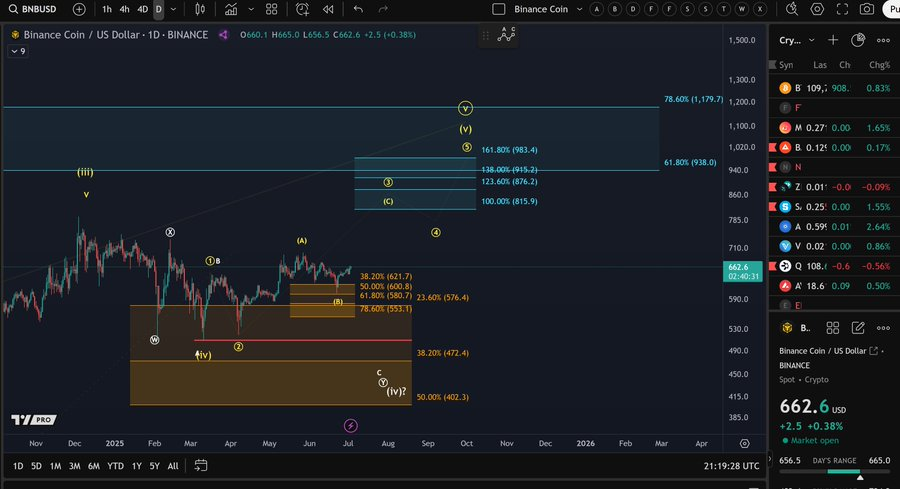
Source: TradingView
With the RSI and the MACD signaling bullish, the token can soar to $700. The traders are keeping an eye on any break above the important resistance levels. Cryptocurrency might face more bullish price levels in the weeks ahead.
