Notcoin (NOT) Plunges 66% Since May – Is This the Bottom or Just the Beginning?

Bears maul Notcoin as NOT crashes two-thirds from its May highs. The memecoin-turned-'utility-token' now trades at levels last seen when crypto Twitter still believed in 'buy the dip' strategies.
What's next for the battered asset?
Technical charts show NOT clinging to critical support—break this, and we're back to pre-pump territory. Meanwhile, perpetual funding rates suggest shorts are getting greedy (always a dangerous sign in this casino).
Funny how these 'community-driven' projects always crash hardest when the community realizes their bags aren't getting lighter. Maybe they should've spent less on Telegram bot development and more on, say, actual demand drivers?
One trader's take: 'Either NOT finds buyers here at 0.0035, or we're looking at another 50% drop before the next speculative frenzy.' Place your bets.

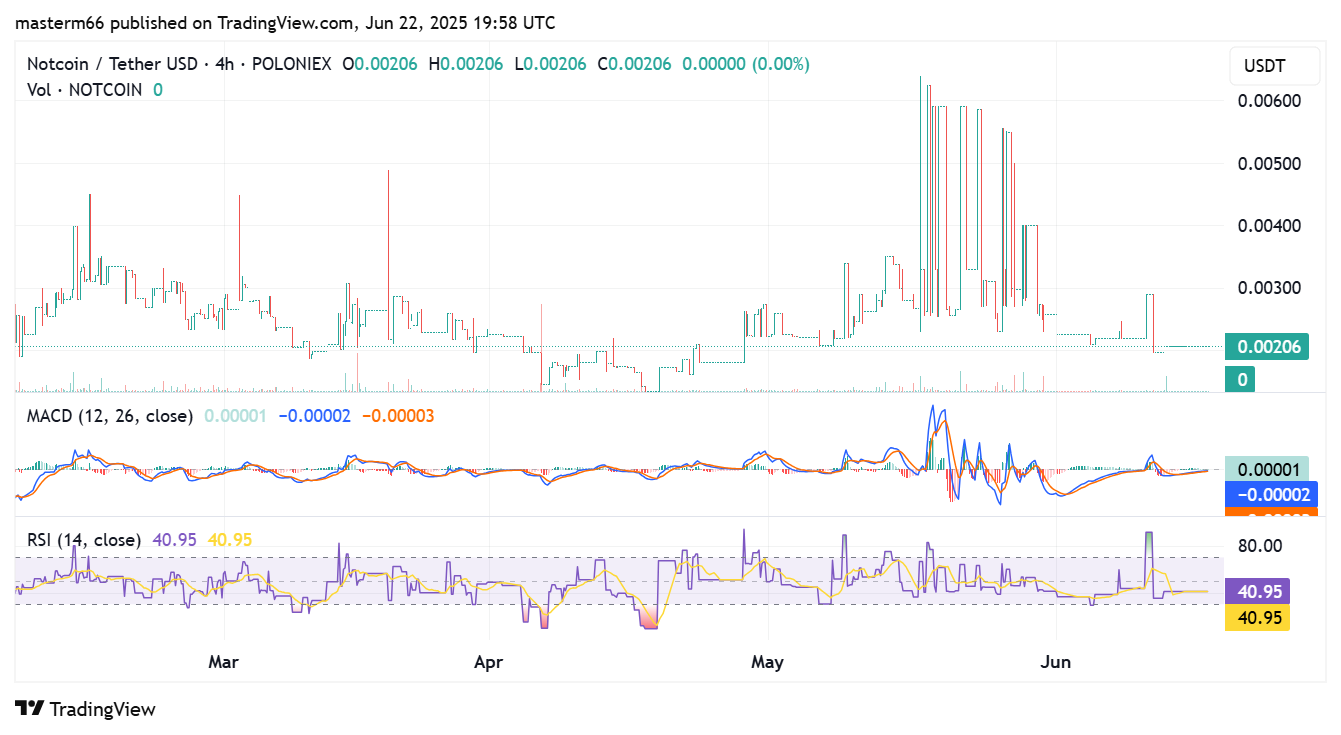
- Notcoin price is stuck at $0.00206, and there are no trading volumes, reflecting confusion in the market
- The technicals in the form of flat MACD and weak RSI indicate further pressure on the downside
- Narrow Bollinger bands hint at a breakout to the downside; since the peak in May, the token has lost 66% of its value.
Notcoin (NOT) is once again making headlines, but not in a good way. The price has stalled at $0.00206, and there is no alteration in the previous sessions. The TradingView chart shows no activity and trading volumes have completely dried up, indicating a market that lacks direction or excitement.
Notcoin Declines: Technical Indicators Confirm Bearish Outlook
The 4-hour chart tells the story. Since reaching peak levels in May, Notcoin has steadily declined. The token has lost roughly 66% of its value from this point.
Notcoin had a brief surge earlier in June but failed to hold gains. The price breached the $0.006 level with a major break but plunged almost immediately, where no good support was detected above 0.003. The average Directional Index (ADX) is at 18.03, which is much lower than the 25 mark that indicates a strong trend.
With the absence of the trend momentum, the price WOULD likely move flat or even drift further downward. BBTrend is at -9.20, which is an advantage for the bears. The sellers may be hoping that it will rebound so that they can increase their pressure or have just walked off the market in the meantime.
Flat MACD, Weak RSI, and Tight Bollinger Bands Hint at Breakdown
The MACD indicator is flat and barely moving, with both MACD and signal lines hugging zero. No crossover means no bullish or bearish conviction is currently forming. This supports the idea of indecision among traders.
RSI stands at 40.95, lower than the neutral position of 50. It is not yet in oversold territory but close enough to imply a lack of keen buying actions. In case RSI declines further, it can be an indication that the token’s price will decrease further.
Source: TradingView
Bollinger bands are getting narrow, providing an indication that a breakout will occur in the short-term. But there’s no guarantee of direction.
Fibonacci retracement levels show resistance around $0.0029 and $0.00347. Any breakout above these would be watched closely, but Notcoin hasn’t shown strength to test these levels yet. It’s currently hovering at the 0.236 level NEAR $0.00219, and failing to break higher could lead to a retest of the $0.00177 base.
