SUI Plunges Below Critical Neckline: Analysts Predict Steeper Decline Ahead

SUI's price action just triggered alarm bells—breaking below a key support level that traders had been white-knuckling. Here's what's next for the embattled altcoin.
Technical Breakdown
The neckline—a make-or-break zone on charts—has officially cracked under selling pressure. Market technicians are now mapping downside targets, with some whispering about a potential cascade.
Market Sentiment
Fear's creeping back into crypto markets as SUI joins the list of assets violating critical levels. Traders who bought the dip are now learning the hard way why 'support' is just resistance that hasn't happened yet.
What's Next?
Unless bulls stage an immediate recovery, expect more pain. The breakdown suggests we're not just looking at a pullback—this could be the start of something uglier. As always in crypto, the 'fundamentals' will matter exactly zero until price stops hemorrhaging.

- SUI forms head and shoulders pattern and is in the process of breaking down neckline support.
- Token is currently trading below 9-day EMA and 50-day SMA.
- The large trade volume coincides with the continuation of the bearish pattern.
SUI, the governance token of the Sui blockchain, is hinting at further price drops. As the latest chart by Alpha crypto Signal shows, the token has just finished a traditional head and shoulders pattern. Traders tend to connect this signal with the decline of price.
Head and Shoulders Pattern of SUI Suggests a Price Breakdown
In technical analysis, a head and shoulders pattern is formed when a cryptocurrency rises, falls, rises again even higher, falls yet again, and finally makes a lower high followed by another drop in price. This structure was visible on the SUI daily chart, and the breakdown is now in motion.
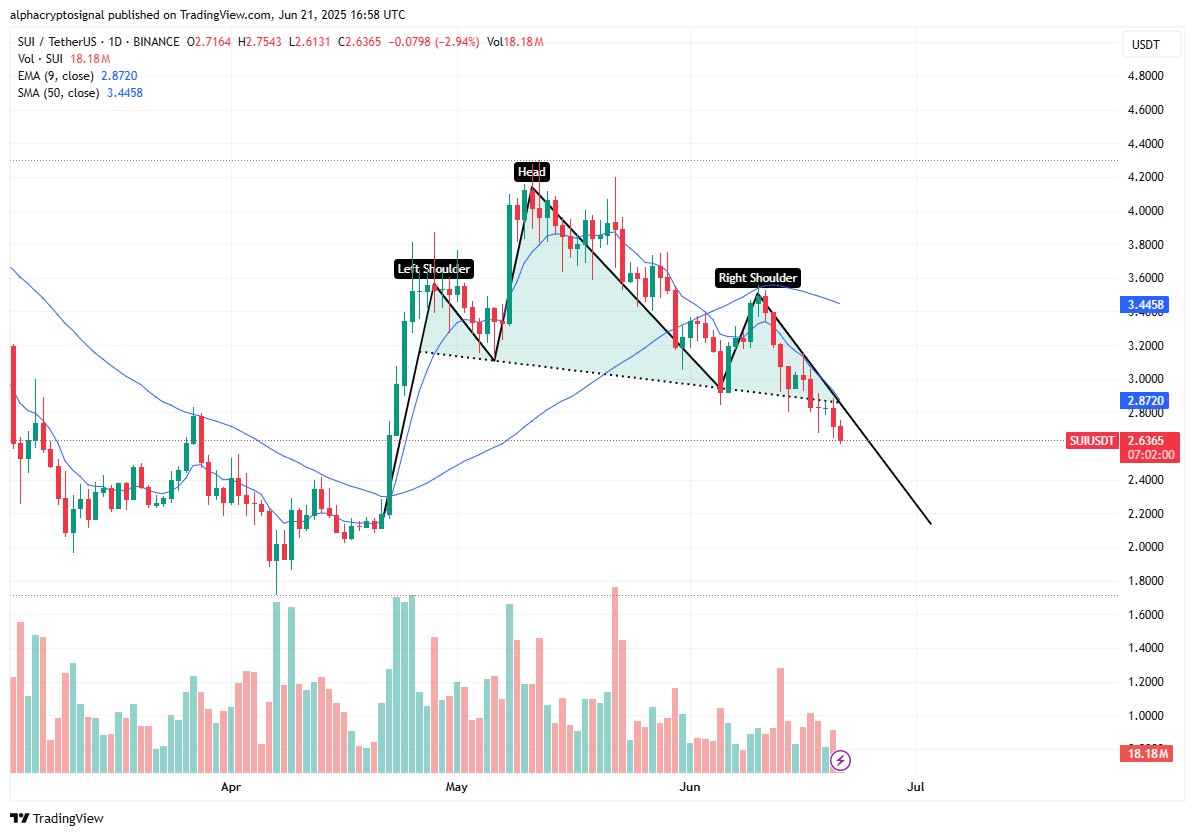
Source: X (@alphacryptosign)
The “left shoulder” formed in April, the “head” peaked in May, and the “right shoulder” completed earlier in June. The neckline support line, which held the price up during previous dips, has now been broken. The occurrence of this break represents a movement in the structure of the market, and it’s bearish.
Once this neckline support had been broken, SUI started to FORM a succession of lower highs and lower lows. This implies that the token is not just having a hard time rising, but it is depreciating in value. Such price movement implies a solid selling pressure.
SUI Falls Below Significant Moving Averages
As reflected in the chart, the token is trading at a price of $2.63, an almost 3% drop in the last 24 hours. Not only is it trading below the 9-day exponential moving average (EMA), but also, it is trading below the 50-day simple moving average (SMA). This usually suggests continued weakness.
Alpha Crypto Signal warns that unless sui quickly reclaims the neckline zone, the downward momentum is likely to continue. For now, the bias remains bearish. This means that most traders should expect the price to fall rather than rise.
Meanwhile, the traders could seek to sell when the price makes a weak retest of the neckline area and does not break into the up direction. In this case, every slight price increase may be accompanied by additional selling.
