Bitcoin at a Crossroads: Soaring to $171K or Crashing Below $100K? Critical Levels Traders Can’t Ignore

Bitcoin's next move could make or break portfolios—again. The crypto kingpin is teetering between a moonshot to $171K or a brutal rejection below six figures. Here's what's at stake.
The Bull Case: When FOMO Meets Fibonacci
Whales are stacking sats ahead of what could be Bitcoin's most explosive rally yet. The $171K target isn't just hopium—it's the 1.618 Fibonacci extension from the last cycle's blow-off top. Institutional inflows suggest Wall Street finally cracked open its vaults.
The Bear Trap: Liquidation Looms
Not so fast. A rejection at current levels could trigger cascading liquidations down to $99K—where over $2B in leveraged longs would get vaporized. The 'dumb money' indicator just flashed red for the first time since the 2021 top.
The Bottom Line
Whether you're a diamond-handed HODLer or a degenerate futures trader, these next 72 hours will separate the crypto faithful from the rekt. Just remember: in a market where 'fundamentals' mean Elon's latest tweet, technicals are the only gospel left. (That and the fact Goldman will issue a 'sell' rating precisely 3 minutes after the breakout.)

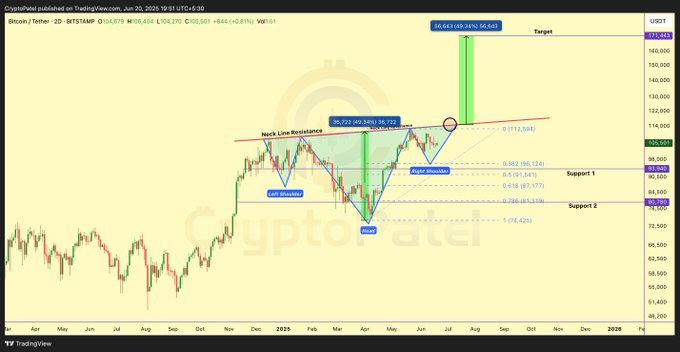
- Bitcoin’s inverse head and shoulders pattern could trigger a 49% rise, potentially reaching $171,000.
- Key support levels at $93,940 and $80,780 will determine Bitcoin’s future movement amid volatile conditions.
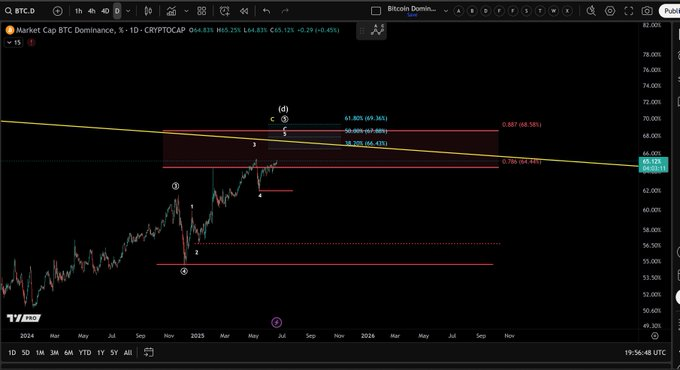
- Bitcoin dominance may rise to 66%-67% as market conditions improve, leading to more favorable spot buying.
Bitcoin has started giving positive indicators of a direction, with analysts indicating that an inverse head and shoulders pattern has formed on the 2-day chart. Crypto Patel believes that if this pattern is completed in full, Bitcoin could experience an upside movement of 49%, reaching a value of $171,000.
According to the analysis, the left shoulder and the head are already developed, whereas the right one remains in the process of formation. The main neckline of this structure is on the space between $112,500 and 115,000. Any breakout higher than this range might mean a massive price increase.
Source: X
Whales tend to exploit the pattern when it is detected by all the participants in the market. This may result in fake outs, stop hunts and forced liquidation. The bullish setup may easily turn bearish should bitcoin decline below or around the low point of the right shoulder. Such a situation may result in a dive in the price.
Key Support Levels for Bitcoin
Support levels will play a crucial role in determining the future course of action for BTC. The first support area will be at around 93,940, which is at the 0.382 Fibonacci retracement level. The second support area is at the $ 80,780 level, which corresponds to the 0.786 level of Fibonacci. Failure by BTC to sustain these levels could lead to another drop.
Market dominance of BTC is also likely to increase. According to More crypto Online, the dominance of BTC may end up being in the range of 66-67%. This increase has been attributed to the good performance of BTC, especially after the recent liquidations as it has provided a conducive environment favorable to spot purchases.
Source: X
ATH or $100K? BTC’s Next Move
Michael van de Poppe noted that if BTC surpassed this price, it WOULD signal the start of a new all-time high (ATH). A close breakout above this point would probably result in additional bullish action, attracting additional buyers.
Conversely, if BTC fails to breach the $106,000 mark, the probable next entry point for traders might be at a lower rate below the $100,000 mark. That would be a critical level to monitor for people seeking better entry points.
Source: X
The BTC market remains precarious, as both bullish and bearish futures present possibilities. The inverse head and shoulders pattern indicates that there can be a rally, although the threat of liquidation and manipulated markets remain.
In case BTC fails at sustaining its prices above $100,000 the market might soon adopt a bearish trend. But if the pattern holds, Bitcoin may shoot up to around $171,000, which promises a hefty opportunity to traders holding a good position.
