Pi Network (PI) Nails $0.53 Support: Traders Brace for Explosive Rebound

Crypto's favorite underdog hits make-or-break territory.
Pi Network's native token tests critical support at $0.53—a level that's either springboard or quicksand for bulls. Market watchers are split between those seeing blood in the water and others spotting the dip of the decade.
The technical setup screams 'pivot point.' A hold above $0.53 could trigger algorithmic buying frenzies, while failure risks turning mobile miners into bagholders. Volume patterns suggest either capitulation or accumulation—take your pick based on your risk tolerance.
Meanwhile, Wall Street 'experts' still can't decide if Pi's grassroots model is genius or just another crypto casino chip. Either way, retail traders are placing their bets.

- The level of over $0.53 is maintained by Pi Network, with traders looking forward to the possibility of a bounce.
- Bullish MACD crossover and oversold RSI indicate signs of near-term reversal.
- A break above the $0.5775 level creates a path to the level of $0.64 and higher.
Pi Network (PI) trades at about $0.538, above the vital support area at about $0.53. According to TradingView data, there has been selling pressure on the token since early-June when the price was within the $0.70 range. While the seller side is still in charge, momentum indicators point otherwise.
Oversold RSI Indicates That a Rise May Be Imminent
The RSI in the 4-hour chart is at a value of 38, indicating that it is oversold. Indeed, the MACD is indicating that there is little momentum, yet it is beginning to build a weak bullish crossover.
Such a signal does not give strong evidence, yet it leaves a possibility of a slowing down of downtrend. The volume is healthy, as more than 1.8 million Pi have been traded. What this implies is that interest in the asset is continuing even though its price is weak.
ADX is above 50, and this tells us that there is a strong trend. But in the circumstances in which the ADX is high but the RSI is low, it usually indicates the possibility of a reversal.
Bollinger Bands reveal that the price is approaching the bottom band at $0.5151. This present level can serve as active support. In case it cannot be maintained, the next psychological level will be $0.50. In the event of a fall below that, a cushion may be provided by the $0.48 level.
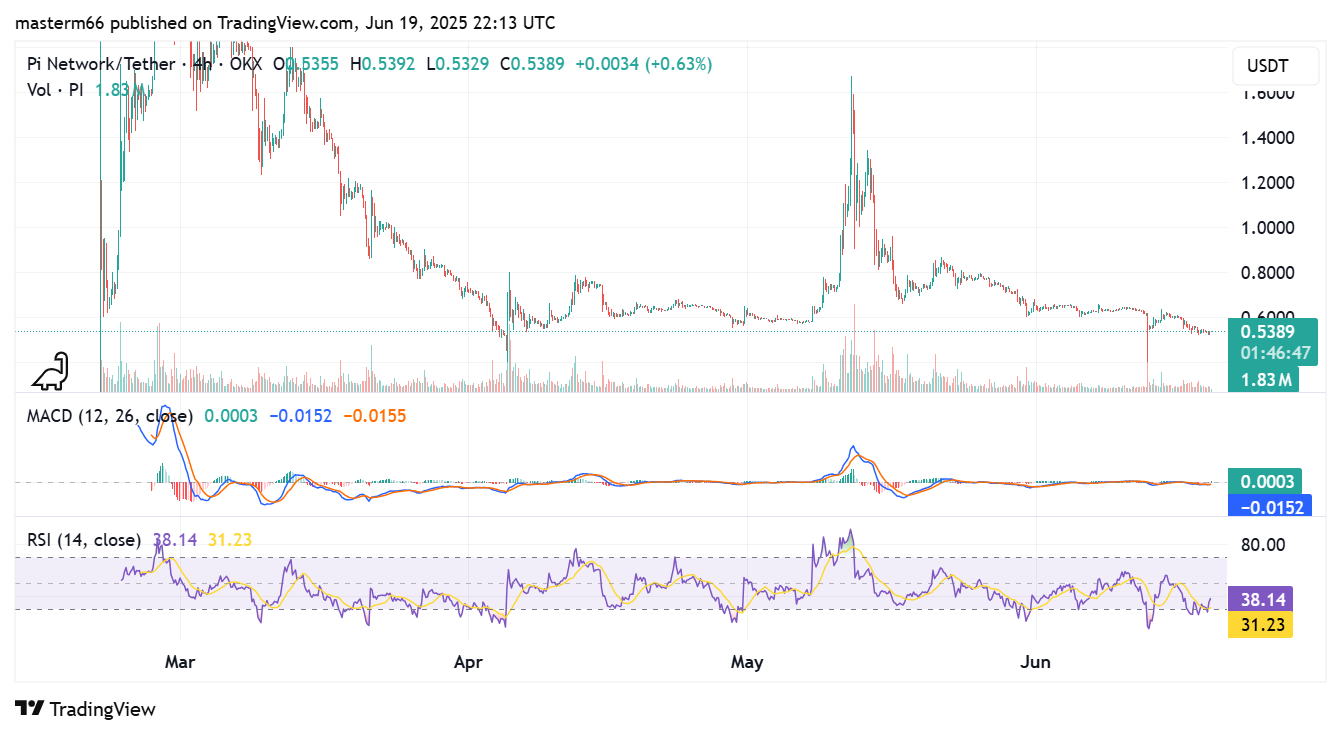
Source: TradingView
The Oversold Conditions Are Indicators of a Potential Bounce
At the moment, SuperTrend shows a red signal, and the resistance lies around $0.5775. Bulls need to break this to confirm a change in sentiment. Fibonacci retracement levels show key resistance between $0.638 and $0.711. That zone may stall any short-term bounce.
If the price breaks above that range, it opens the path to $0.8276 and higher. For now, PI remains in a clear downtrend. But early signs suggest sellers may be losing steam.
Short-term traders might be looking for a bounce if support NEAR $0.53 holds firm. Long-term investors may be watching closely for confirmation that the bottom is forming.
The current setup is not yet bullish. But it does offer the potential for a technical recovery. Momentum is weak but no longer declining rapidly. That often precedes a price reaction in either direction.
The market is also consolidating near a previous support zone, which adds interest for bargain hunters.
Pi Tests Critical Juncture: Hold or Fold at $0.53 Support
Until price moves above $0.5775, risks remain tilted to the downside. If bulls regain that level, $0.64 becomes the first challenge to overcome.
Overall, Pi Network is at a tipping point. Traders may be preparing for a breakout or breakdown soon. The next few sessions will likely determine if $0.53 becomes a springboard or a trap.
