Solana Dips Under $150—But This Bullish Pattern Hints at a $220 Breakout

Solana's price takes a hit—but don't count it out just yet. A textbook bullish pattern suggests this dip might be the calm before the storm.
Technical traders are circling. The setup? A classic consolidation phase with a potential breakout target of $220. Meanwhile, retail investors panic-sell—because nothing fuels crypto volatility like herd mentality.
Active traders see opportunity. The $150 level now acts as a litmus test: hold here, and the path to $220 clears. Fail, and well… at least the memecoins are still pumping.
One cynical take? Wall Street’s still trying to short crypto—while quietly accumulating bags. Some things never change.

- Solana shows a 5.88% daily decline, but technical indicators suggest a bullish breakout.
- Analysts highlight a completed bullish flag pattern, hinting at targets of $165, $183, and $220.
- Price predictions for 2025 range from conservative gains to new all-time highs above $328.
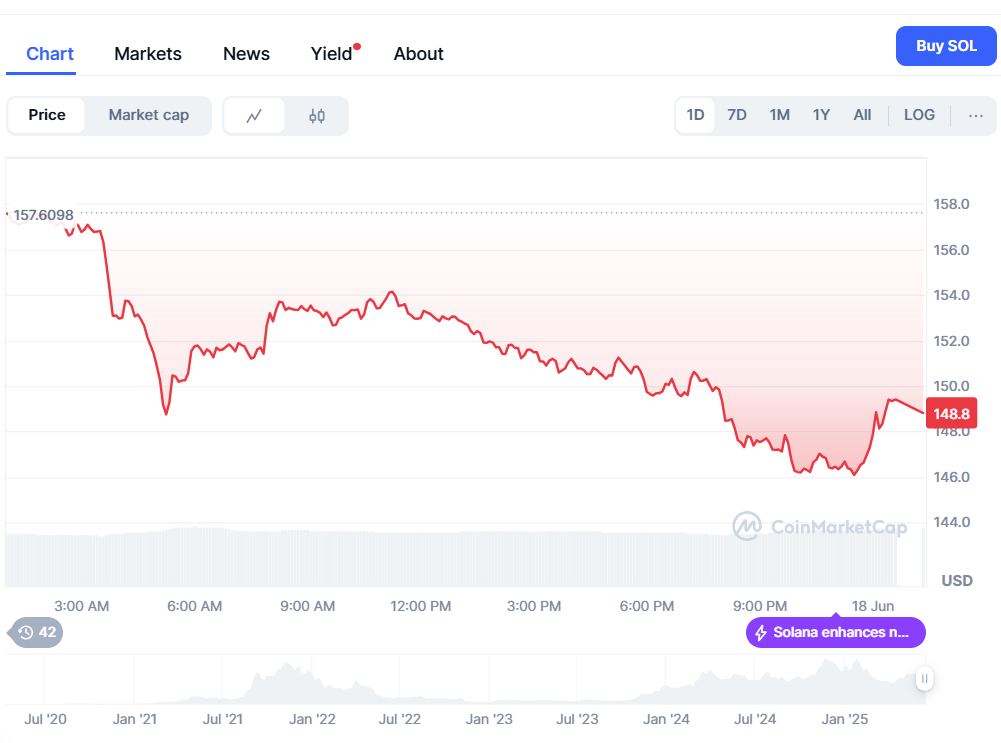
Solana (SOL) is currently trading at $149.21, marking a 5.88% decrease in the last 24 hours. Despite this decline, trading volume has increased 8.11% to $4.81 billion, suggesting heightened investor activity. Over the past week, SOL has slipped 9.25%, maintaining a near-flat position from seven days ago when it traded at $149.18.
However, crypto analysts point to an optimistic technical formation. According to CryptoIlokano, SOL has successfully completed a bullish flag pattern on the 12-hour chart. The pattern, a staple among chart technicians, typically indicates a continuation of upward price movement following a brief consolidation phase. Historically, bullish flags precede upward breakouts approximately 65% of the time (Warrior Trading, 2014).
Technical indicators show solana consolidating just above the 50-period moving average (MA50), a signal often linked to sustained bullish momentum. The flagpole of this formation stems from a late-May surge that lifted SOL from $120 to $150, followed by a tightening price range between $145 and $150 throughout mid-June.
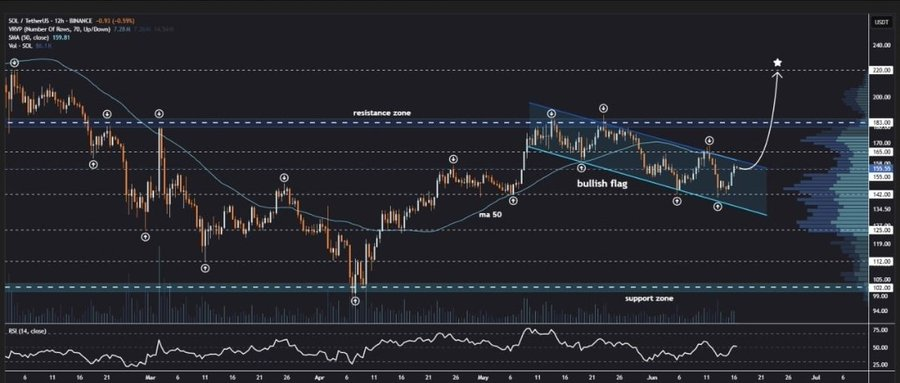
RSI shows neutral to bullish momentum
In its price breakout continuation, if Solana does further, the possible targets that CryptoIlokano sees are at $165, $183, and $220. There are also upward trendlines around $155 which can act as a strong support and help push prices higher.
The chart indicates that the RSI (a momentum indicator) is between 50 and 70, that implies the market looks steady or slightly bullish (not Overbought as per). The trading volume has been waning gradually which is expected during this kind of pattern, often this comes before a strong move.
The chart uses a dark candlestick style with marked resistance levels, showing that traders are paying attention. With more big investors getting involved in early 2025 (according to Forbes), Solana’s price movement might not just be from regular traders, it could be part of a bigger plan as the market waits for clearer rules.
Solana price prediction for 2025
DigitalCoinPrice is optimistic and thinks SOL could go above $328.24 by the end of 2025. They also expect it to hit $294.33 and $296.11 earlier. If this happens, it WOULD beat SOL’s previous record high and show a strong recovery from today’s prices.
In contrast to the forecast of Changelly, the tone here is more conservative. They envisage a maximum price of $158.45 by 2025 and an average trading value of $159.22 per coin, also an ROI that investors may expect at 5.9%. The forecasts in June estimated over $151 as a mean with a narrow range for monthly trading.
Despite short-term swings, a long-term thinking is guardedly bullish as the following demonstrates with patterns and technicals potentially favouring Solana.
