Notcoin (NOT) Slips 0.53% as RSI Nears Oversold – Buy the Dip?

Notcoin (NOT) takes a breather after its recent rally, dipping 0.53% as its Relative Strength Index (RSI) flirts with oversold territory. Is this a temporary pullback or a sign of deeper fatigue?
RSI teases oversold levels
The token''s RSI—a key momentum indicator—hovers near the oversold threshold, often a contrarian signal for traders. Historically, NOT has rebounded from these levels, but past performance doesn’t guarantee future results (as the SEC would happily remind you).
Market watches for next move
Traders are eyeing whether NOT holds support or cracks under pressure. With the broader crypto market choppy, NOT’s next move could hinge on Bitcoin’s mood swings—because, as always, altcoins dance when BTC sings.
Bonus jab: Another day, another crypto ‘correction’ that may or may not be a prelude to a ‘strategic reaccumulation phase’ (read: bagholders praying for a rebound).

- NOT dipped 0.53% as the bearish pressure continues, and the token is trading below the major support.
- The RSI 4-hour chart is approaching the oversold range, which may indicate that there is a potential of selling exhaustion.
- As the Bollinger Bands are narrowing while pressing downward, a sharp price movement may soon unfold in either direction.
NOT, the native token of the Notcoin project, has declined by 0.53 percent over the past day of trading, trading around $0.0165 at the time of writing, according to TradingView data. Analysts noted that there is a build-up of the bearish momentum after the token earlier fell below an important support point of $0.017.
The pressure towards the downside has been facilitated by the selling interest and weaker market sentiment, which could be additionally justified by on-chain factors and chart indicators. The volumes traded were not very high, and that too has caused being bullish again difficult.
What a 30 RSI Value Means for NOT’s Price Action
Technical analysis pointed out that the RSI on the 4-hour chart is currently NEAR 30, suggesting that NOT may be approaching oversold territory. This could indicate that sellers are getting exhausted and a potential price bounce might be forming, but confirmation is still lacking.
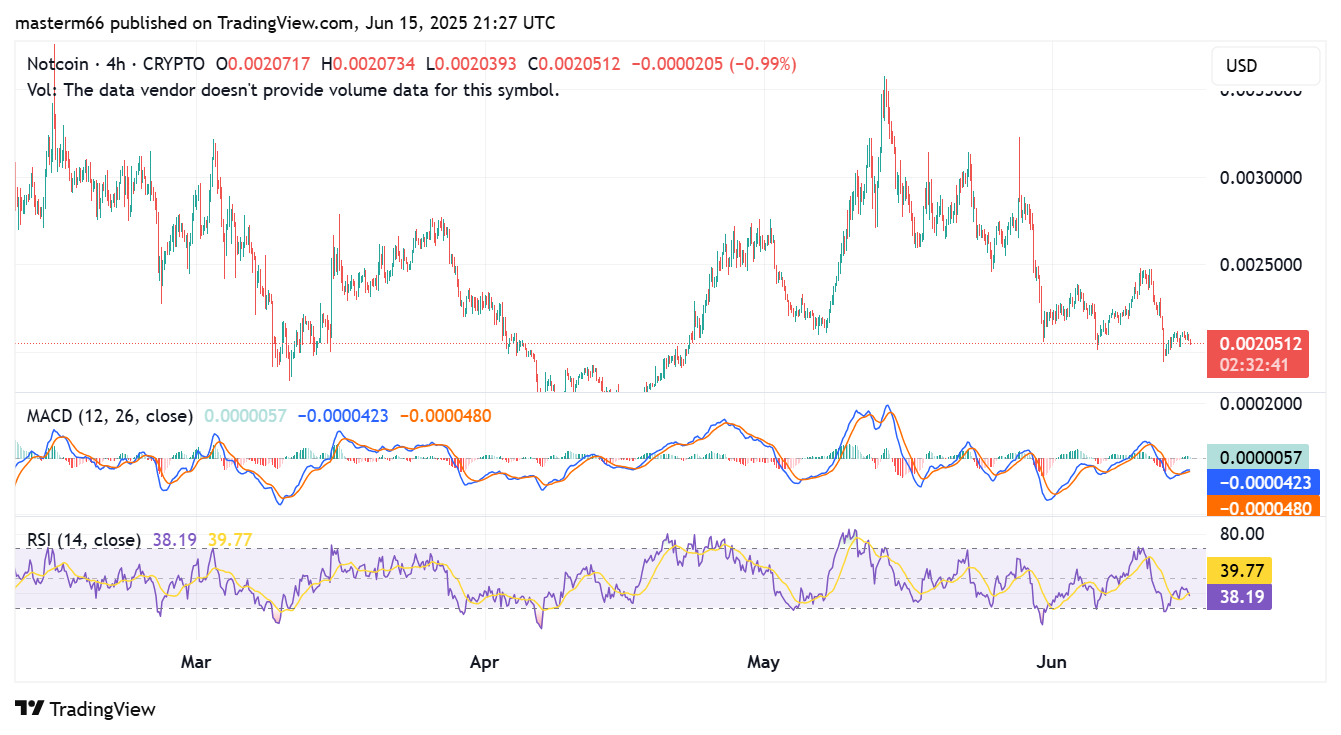
Source: TradingView
Adding more weight to this uncertainty is the MACD, which currently shows the MACD line attempting to cross above the signal line from below. Although this bullish crossover is forming, the histogram continues to print small red bars, and this implies that buying pressure is not strong yet.
This early indication is encouraging the idea of a possible short-term correction, although the risks of price weakness remain intact.
Tightening of the Bollinger Bands Hints at a Possible Breakout
Evaluating the Bollinger Bands on the 4-hour chart, analysts point out to a squeeze, as the upper and the lower bands tighten against the price. This volatility squeeze is normally a pre-pointer to an aggressive movement.
The crypto’s price is now trading on the lower band, indicating a possible downside break. The intermediate band (20-SMA) has taken the position of immediate resistance, covering a value of around $0.00257. The upper band will be at around $0.00277 and could serve as the upper target in case the momentum reverses.
Related Reading | ApeCoin Price Holds Steady Above Key Support, Eyes Potential Rebound
