🚀 Ethena (ENA) Primed for Takeoff: $0.32 Entry Could Fuel 400% Rally

Ethena''s ENA token flashes a rare buy signal—and the upside could make TradFi returns look like pocket change.
The Setup: A bullish breakout pattern suggests ENA''s current $0.32 level might be the last bargain before liftoff. Technicals hint at a potential 400% surge if key resistance cracks.
Why It Matters: While Wall Street debates inflation targets, crypto traders chase asymmetric bets. ENA''s risk-reward ratio here? Arguably better than your financial advisor''s ''diversified'' portfolio.
Watch These Levels: Sustained closes above $0.35 confirm momentum, while a drop below $0.28 invalidates the thesis. Either way—someone''s getting rich or rekt by Q3.

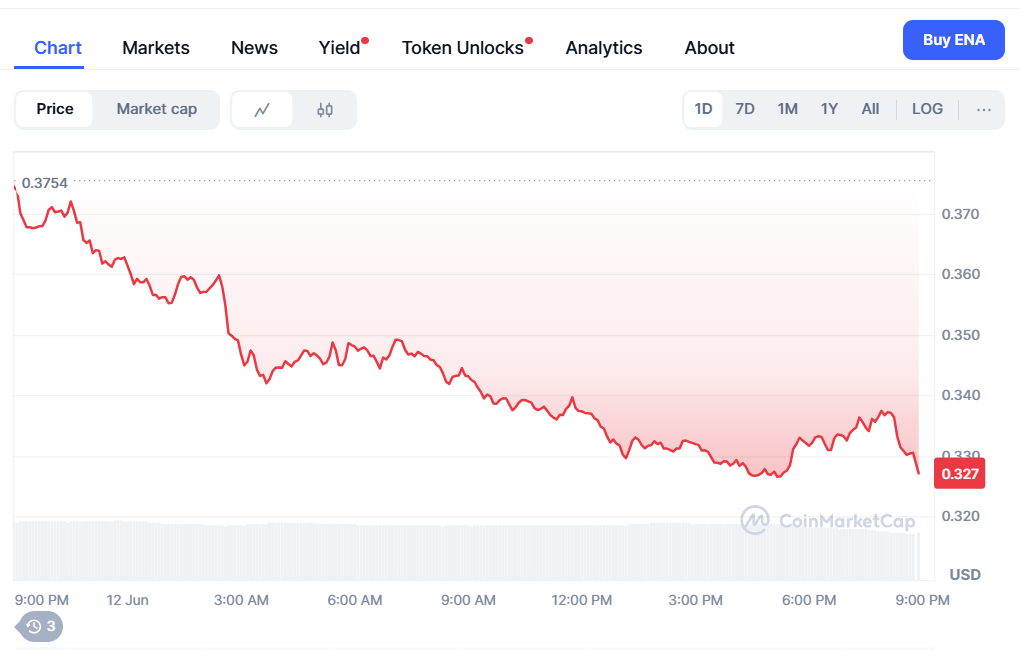
- ENA is currently down 13.62%, trading at $0.3242, with trading volume also sliding.
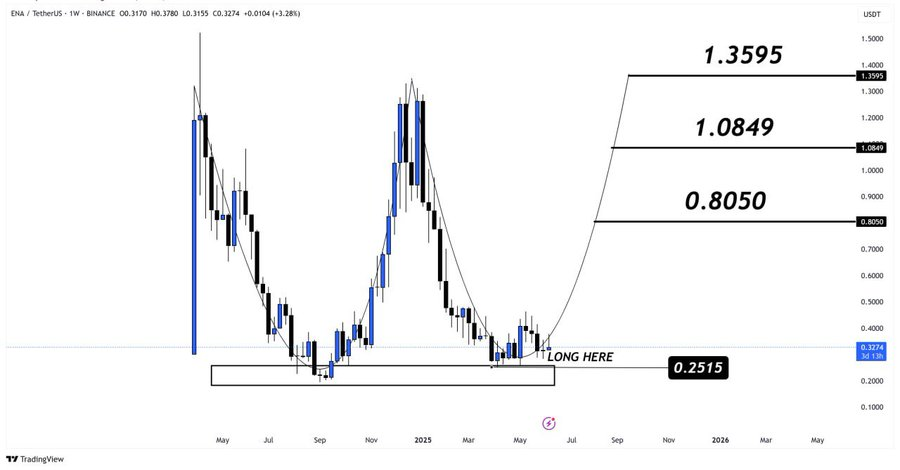
- Technical analysts identify a potential long opportunity with a bullish target of up to $1.35.
- Price predictions for 2025 remain mixed, reflecting both bullish and bearish scenarios.
Ethena (ENA), the native token of the decentralized finance platform Ethena Labs, is currently trading at $0.3242, marking a 13.62% daily decline. With a 24-hour trading volume of $239.36 million, down 18.65%, the token’s immediate momentum reflects short-term bearish pressure. However, on the weekly scale, ENA shows a minor gain of 4.42%, indicating some resilience amid broader market fluctuations.
Technical sentiment within the trading community remains cautiously optimistic. Analyst VipRoseTr outlines a potential long-entry strategy, pinpointing key accumulation zones at $0.32 and $0.31. With a stop-loss recommendation at $0.18, the strategy implies a conservative risk buffer. Targets stretch from $0.80 to $1.35, suggesting a substantial upside if support levels hold and market sentiment improves.
The broader macroeconomic environment, including falling U.S. inflation numbers, could play a pivotal role in influencing crypto market sentiment. Lower inflation often encourages risk-on behavior among investors, potentially acting as a tailwind for assets like Ethena.
Fibonacci Levels as Resistance and Consolidation Zones
A deep-dive into the technical chart of ENA, spanning from 2019 to projected price action into 2025, highlights a candlestick formation paired with a logarithmic scale, ideal for tracking volatile assets. The formation of a rounded bottom, with a low NEAR $0.251, suggests a base-building phase that could precede a breakout.
The chart highlights Fibonacci retracement levels at $0.850 (potential 0.618 zone), $1.049 (0.786 level), and $1.359 (an extended target). These levels suggest calculated projection zones where price action may meet resistance or attract consolidation. For swing traders, this roadmap provides a framework to navigate volatility and define risk-adjusted entry points.
Importantly, the technical strategy is supported by a stop-loss at $0.18, limiting downside risk to under 30% while aiming for a potential return exceeding 400%, aligning with strong risk-reward principles.
Ethena price prediction for 2025
Looking ahead to 2025, predictions for ENA’s performance vary. According to DigitalCoinPrice, Ethena might bounce back and reach about $0.72 by the end of the year, and could even climb close to its past high of $1.52. Some experts are hopeful it might even go above $1.35, which lines up with key market patterns.
Conversely, CoinCodex is less optimistic in its prediction. According to it, Ethena might decrease to $0.2659 in June 2025, which is approximately 17% less than its current value. Its prediction is between $0.233 and $0.334, but it cautions that the immediate future might be bumpy while the future in the long run remains bright.

Log in to Reply
Log in to comment your thoughtsComments
Related Articles
|Square
Get the BTCC app to start your crypto journey
Get started today Scan to join our 100M+ users