LUNC Defies Gravity: Terra Classic Bounces Off Ascending Channel in 4-Hour Rally

Terra Classic (LUNC) is staging a comeback—or at least pretending to—with a textbook bounce off an ascending channel on the 4-hour chart. Traders are either cheering or rolling their eyes, depending on how many times they’ve been burned before.
Bullish signals flashing? Sure. But let’s not forget this is crypto, where ‘technical patterns’ sometimes just mean ‘pretty lines.’
If the momentum holds, LUNC might just claw back a fraction of its former glory. Or it’ll nosedive by lunchtime. Either way, grab popcorn—the market’s favorite soap opera continues.

- LUNC seems to be moving upward since it bounced off the channel’s lower line and is getting closer to the midline, hinting at a possible upward breakout.
- While the volume of trades is high, the ADX and MACD signs indicate that the trend is at its weakest and there is a slight possibility of the market turning down.
- Should LUNC rise above $0.00006500, it would confirm that the price is going higher, whereas a fall under $0.00005964 may lead to further declines.
An analyst, Alpha crypto Signal, on X, has mentioned that Terra Classic’s LUNC looks interesting on a 4-hour chart. Alpha Crypto Signal mentioned that LUNC is at present in a descending channel, a type of pattern in which the price goes down between two tilted lines.
Potential Bullish Turn: LUNC Climb Toward the Channel Midline
This suggests a cautious trend for the cryptocurrency, but there’s some Optimism to note. According to the analysis, LUNC has recently bounced back from the lower part of this channel and is now heading toward the middle.
This movement is seen as a potential turning point by the analyst. If LUNC manages to break through the midline and push past the channel’s upper resistance, turning it into a support level, it could signal a bullish shift.
Hence, the analyst suggests that this could be a good opportunity to consider a “long” position. Moving averages are one of many indicators found in the chart that help understand the token’s important price trends.
Anyone can easily identify the descending channel, which has blue lines, and pay close attention to the midline.
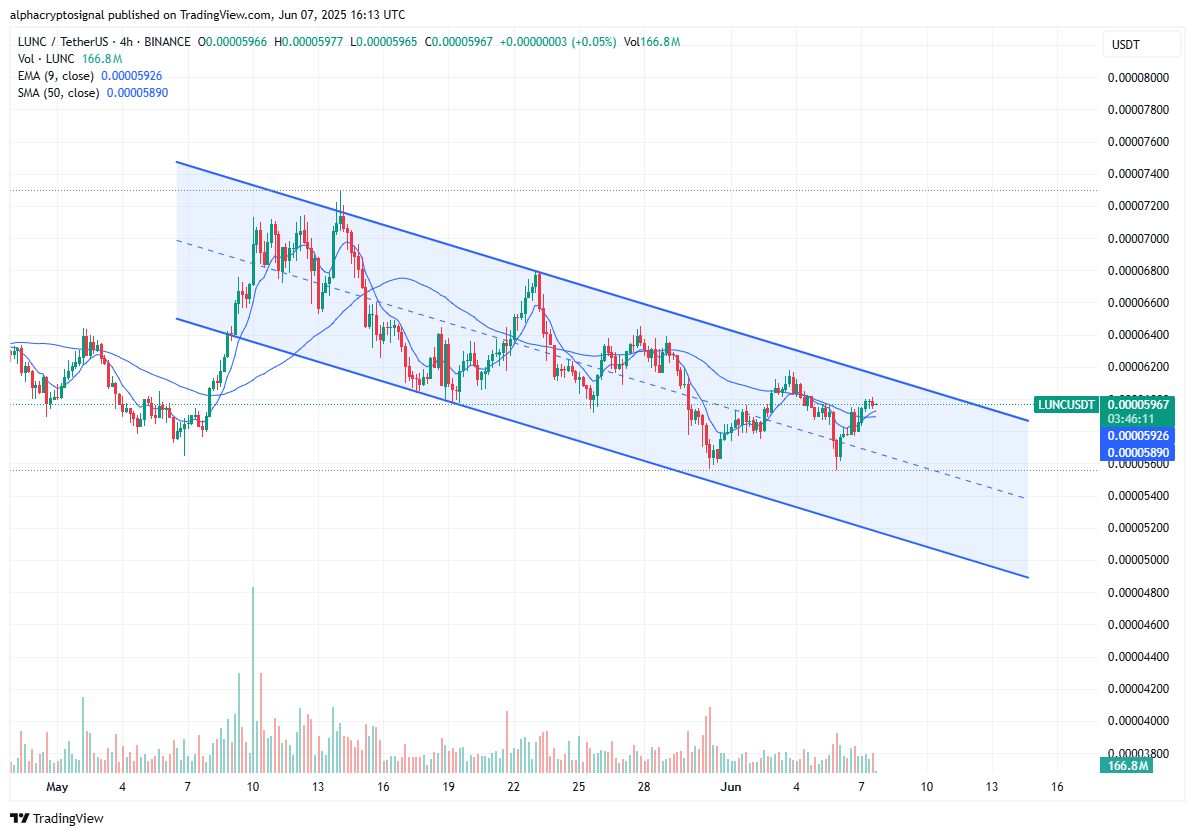
Source: X (@alphacryptosign)
There Are Conflicting Insights and a Lot of Volatility for LUNC Now
As seen on TradingView, trading activity for this cryptocurrency yesterday was very high at $25.72 billion. However, the market seems uncertain, as the main indicators are giving conflicting messages.
According to the ADX (Average Directional Index), the trend is currently weak or absent, since its value stands at 13.3. As a result, LUNC doesn’t have a definite upward or downward movement right now. Also, the MACD (Moving Average Convergence Divergence) is giving a slight negative sign, suggesting there might be downward pressure.
LUNC’s value has gone up and down several times in the past 24 hours. When the price surpasses 0.00006500, traders should focus on an upside breakout, but dropping to 0.00005964 could bring additional downward movement.
This digital asset continues to be an interesting market, however, the weakness in the trend and different signals from indicators suggest that traders should be careful.
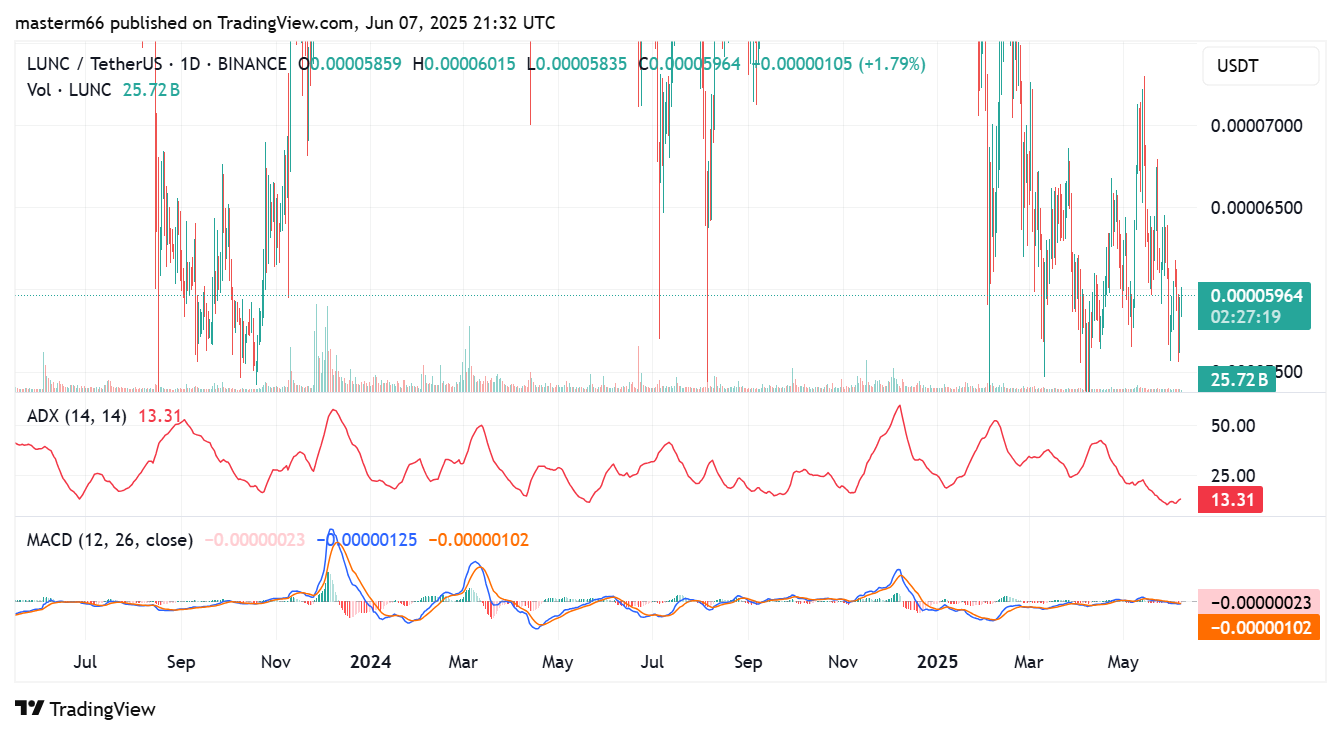
Source: TradingView
