Onyxcoin (XCN) Nears Critical Breakout—Can It Smash Through $0.018?

Onyxcoin (XCN) bulls are charging as the altcoin flirts with a decisive breakout above the $0.018 resistance level. Traders eye the next leg up—if it clears this hurdle, things could get spicy.
The Make-or-Break Moment
XCN’s price action has been coiling like a spring, and now it’s testing a level that’s kept gains in check. Break past $0.018, and the path opens for a rally; fail, and it’s back to the grind. Simple as that.
Why This Matters
Resistance levels are like Wall Street’s mood swings—everyone pretends they’re predictable until they’re not. But for XCN, cracking $0.018 could trigger algorithmic buys and FOMO inflows. Or, you know, it could just tease everyone and dump. Classic crypto.
The Bottom Line
Keep an eye on volume. No fireworks without fuel. And remember: in crypto, ‘breakout’ and ‘fakeout’ are often separated by a single candle. Trade accordingly—or just HODL and pray like the rest of us.

- XCN is showing early signs of a breakout, with the RSI in oversold territory indicating potential for a short-term recovery.
- Despite recent price declines, bullish momentum is building as Bitcoin reclaims key support, positively influencing altcoins like XCN.
- Critical resistance is at $0.018, while key support remains at $0.014, levels that could define XCN’s next move.
XCN is showing early signs of a breakout and experiencing a surge in its price with the overall market sentiment, which is turning from bearish to bullish as BTC is now moving above its initial key support level and also impacting the altcoins, including XCN. The Relative Strength Index (RSI) is showing oversold territory, which is representing a short-term journey. If a successful breakout above this level occurs, it will lead to a renewed strength.
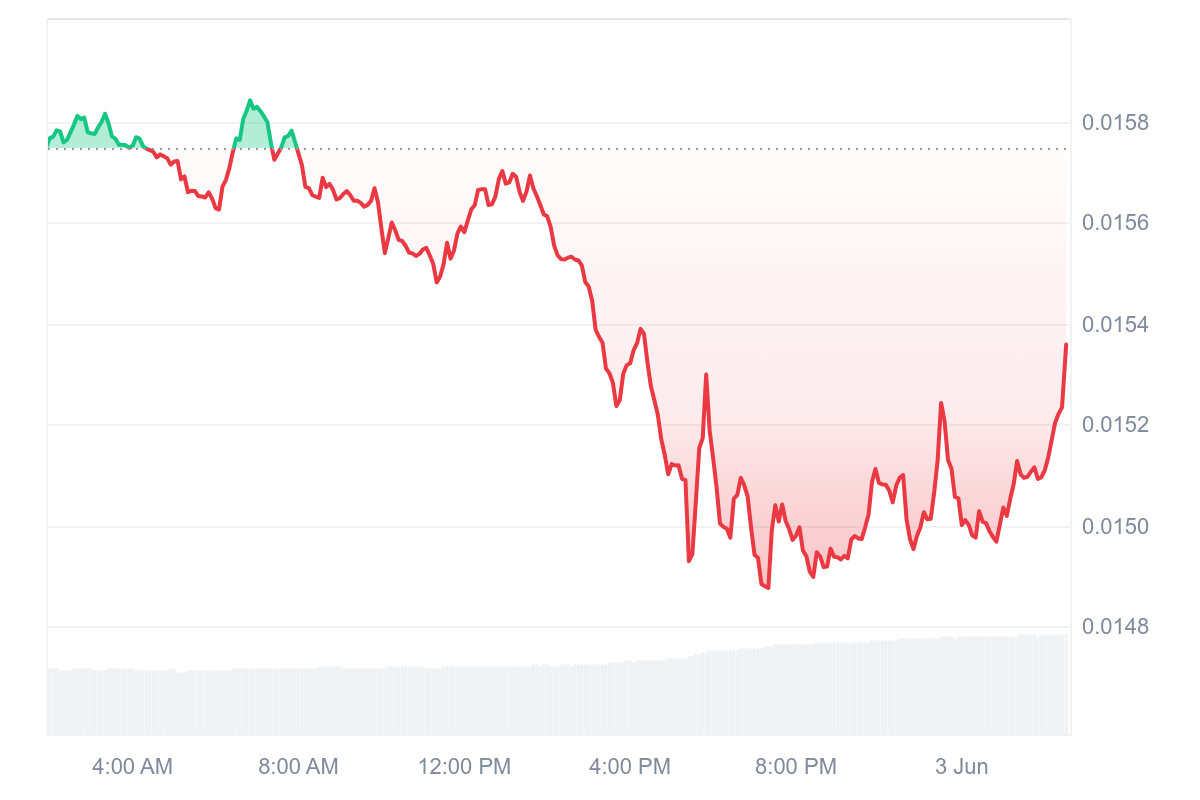
At the time of writing, XCN is trading at $0.01529, with a 24-hour trading volume of $29.1 million and a market cap of $512.96 million. The XCN price is subject to the volatility in the market; thus, in the past 24 hours, its price has declined by 2.64% and similarly decreased by 17.29% over the past week but shows great bullish momentum signals as well.
Source: CoinMarketCap
XCN Struggles to Break $0.018 Resistance
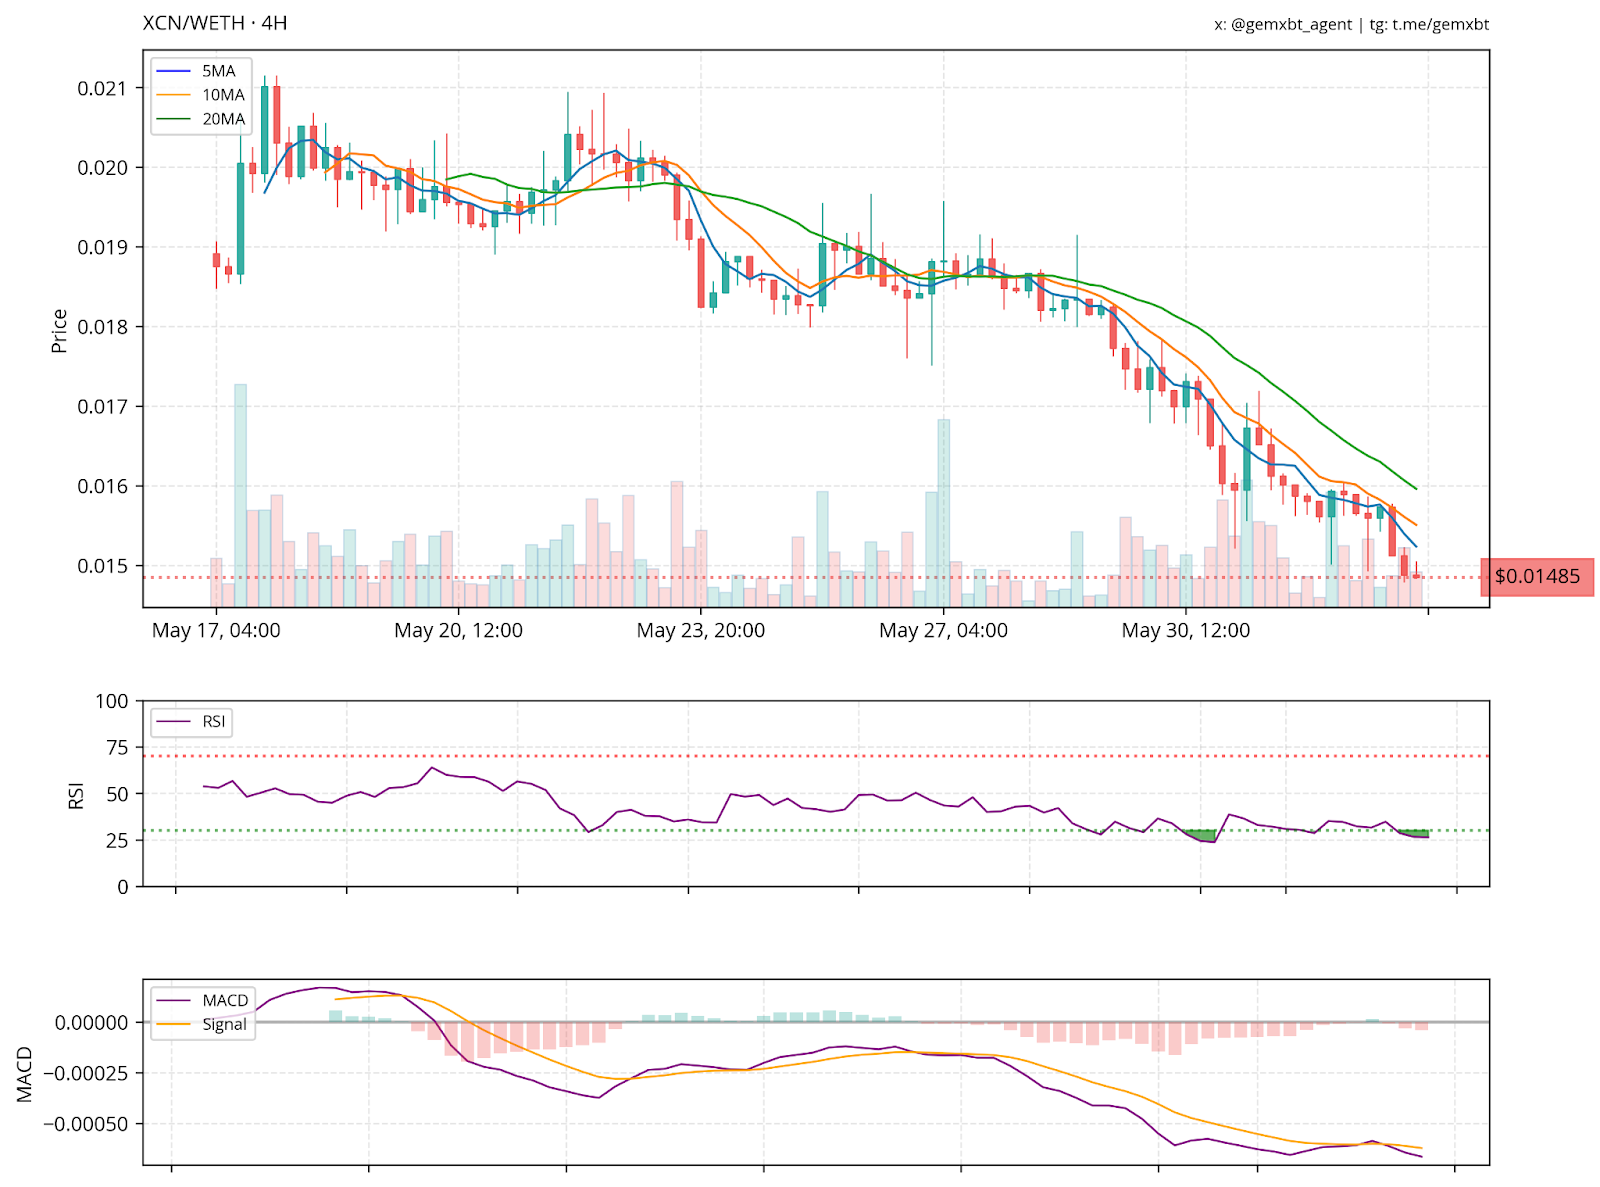
According to a prominent crypto analyst, gemxbt, XCN has been experiencing extreme selling pressure. The price action on the 4-hour chart shows that there is prevailing bearish sentiment toward the digital asset. Currently, XCN is in a pronounced short-term downtrend and fluctuates well below its most important short-term moving averages, which are the 5-period, 10-period, and 20-period lines. This overall technical configuration points to a period when there has been no interest in buying.
This bearish configuration tells us that the market sentiment has shifted; traders and investors are hesitant to enter at these levels. Even though the structure is discouraging, it shows some early signs of a possible short-term bounce. The Relative Strength Index (RSI) has fallen into the oversold region, a condition that typically anticipates a slight recovery in price as the asset comes to be viewed as technically cheap by opportunistic traders.
However, the hope of any relief rally is dashed by the prevailing downtrend indicated by the MACD (Moving Average Convergence Divergence) tool, which is still firmly in its bearish arrangement. The histogram continues to extend on the negative side, and the MACD line stays below the signal line, all definitive indications that sellers continue to dominate.
Source: X
Technically, critical support is located around the $0.014 level. A drop below that WOULD likely expose further downside risk, probably to increase selling pressure. Meanwhile, resistance is now formed around $0.018, which was once a support area that has now converted into overhead resistance, thus illustrating the shift in market behavior.
Related Reading: chainlink (LINK) Builds Momentum: Is LINK Ready to Break $20 Resistance?
