Bitcoin Teeters on the Edge: $106,800 Support or $103,000 Plunge?

Bitcoin’s playing a dangerous game with its head-and-shoulders pattern—classic trader bait. Will the $106,800 support level hold, or are we staring down a slide to $103,000?
Market’s holding its breath while institutional whales pretend they aren’t manipulating everything. As usual.
Time to buckle up—BTC’s next move could be a rocket or a wreck.

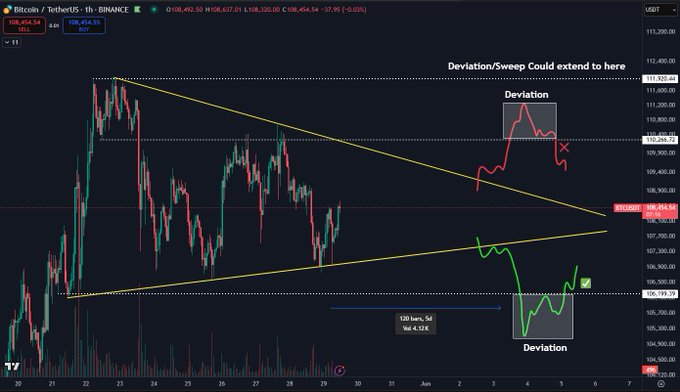
- Bitcoin is consolidating within a narrow range, with the potential for a big price move after this period ends.
- A false breakout is common in consolidation phases, with a major move typically occurring after an initial failed breakout.
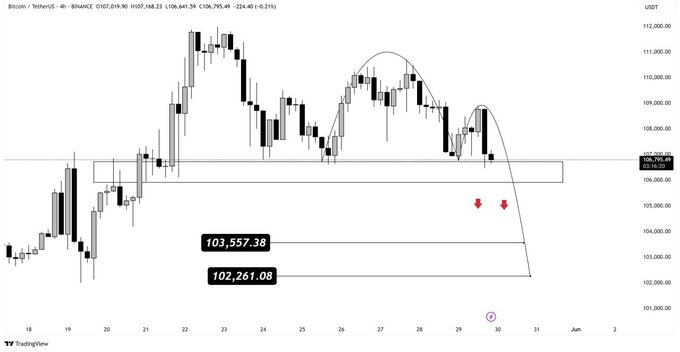
- Bitcoin’s Head & Shoulders pattern at the $106,800 neckline suggests a potential bearish move, with support at $103,557 and $102,261.
Bitcoin’s price is holding steady within a narrow range. Daan crypto trades suggests that the current period of little movement could continue for several more days. A big price change often follows such phases, but traders should keep in mind that triangles and pennants tend to have many fake breakouts.
Source: X
As the price stabilizes, the market pays attention for indications that it might break out. Yet, specialists warn that such patterns might appear to reverse early before turning back the other way. If BTC goes beyond its previous range and then fails to hold its new position, traders might find an opening to enter the opposite way. This usually happens in the stage when prices consolidate, as the major MOVE takes place after the first breakout attempt fails.
Bitcoin’s Breakdown Potential
BTC is forming a Head and Shoulders pattern on its 4-hour chart, which is commonly interpreted as a sign that prices may decrease soon. The pattern is now approaching the neckline support at $106,800 and this level is important for BTC. Should the currency break under $105,000, it might begin moving lower, finding support at both $103,557 and $102,261.
Source: X
A move below the support at the neckline could cause Bitcoin to continue lower and hit the smaller intention targets. The approach depends greatly on how much is being moved when the transaction is made. A decline in price with high volume would show a bearish trend, while a fall with weak volume might mean BTC will reverse and rise again. As a result, traders are waiting with fear, hoping to see a definitive clue from the market.
BTC‘s Critical Test Ahead
In the next few hours, how Bitcoin’s price behaves will help decide the near-term trend. If the neckline proves to be support, the cryptocurrency might stay in its current range and avoid a price fall. On the downside, if traders break the level, it could open doors to a far bigger fall and a stronger bearish trend. Bitcoin’s future over the next few days will be largely decided by what happens in the current phase.
The market is paying attention to how bitcoin behaves as it approaches the Head & Shoulders formation. A large decrease in value accompanied by high volume could cause a significant decrease in price. A decline below the neckline might make it hard for Bitcoin to recover its momentum, but a failure to do so could see it rise once again. Either path, BTC is currently at a key level, so traders should keep a close eye for any significant movements.

Log in to Reply
Log in to comment your thoughtsComments
Related Articles
|Square
Get the BTCC app to start your crypto journey
Get started today Scan to join our 100M+ users