Jupiter (JUP) Eyes $0.64 Breakout—Can the Crypto Rally Hold?

JUP’s price action teeters on the edge of a bullish breakout, with traders eyeing the $0.64 resistance like hawks. Here’s what’s at stake.
Targets in sight: If Jupiter clears $0.64, the next liquidity zones could trigger a FOMO cascade. But let’s be real—since when did crypto markets follow logic?
Watch the charts: Volatility is the only guarantee. Whether this pumps or dumps, someone’s getting rekt while VC bags get lighter.

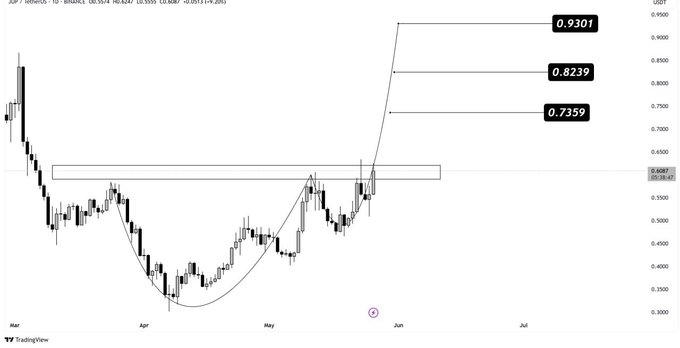
- Jupiter (JUP) is testing a key $0.64 resistance, with breakout targets at $0.7359, $0.8239, and $0.9301.
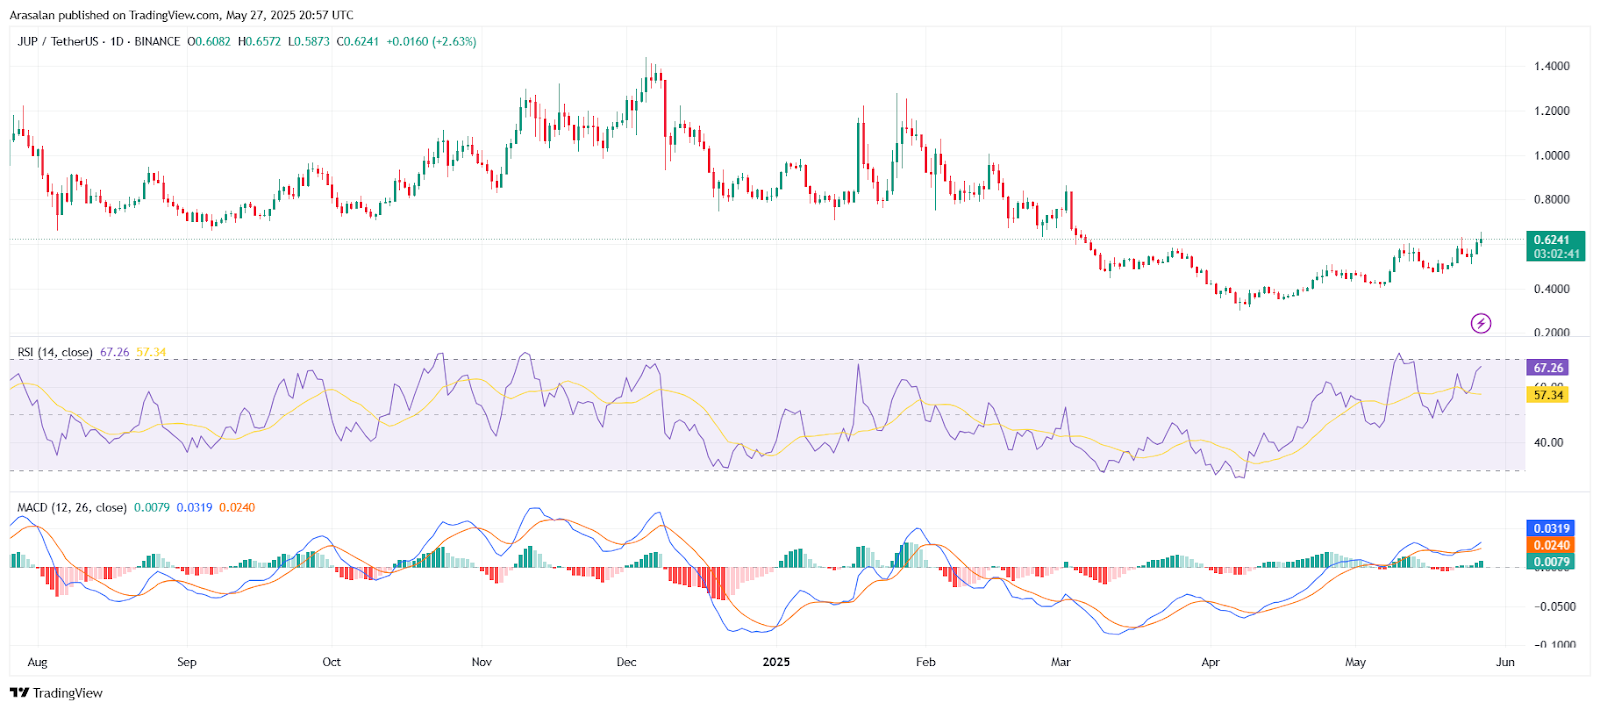
- The RSI is at 67.26, indicating bullish momentum but approaching overbought levels.
- MACD shows positive momentum, but traders should watch for any signs of weakening trend strength.
Jupiter (JUP) is attempting to break out from below, as its price just hit a major resistance area. Rose Premium Signals highlighted that the cryptocurrency is forming a cup, a shape that is taken as a confident sign for bulls. If JUP manages to rise above the $0.60 obstacle, we could expect to see important price changes soon.
Around $0.63 is the breakout range and so far, JUP has yet to clear this important price. If Jupiter closes above this resistance, it could head to higher prices. Key price points during the breakout are $0.7359, $0.8239 and $0.9301. If the rise is confirmed by rising trading volume and positive market feelings, these prices could mark a real rally.
Source: X
RSI and MACD Supports Uptrend Strength
The RSI on the accompanying chart measures 67.26, indicating that the asset is getting close to being overbought. Even with rising demand, the RSI has not reached the level that suggests the market may stop going up. Since the RSI is above 50, the bulls seem to have the upper hand, but everyone should keep an eye out for tiredness among bulls.
The MACD is also pointing in the direction of a positive trend. MACD is showing as a green bar with a higher position compared to the signal line which is also a green bar moving up. Momentum seems to be supporting the bulls. Still, a slight drop on the histogram hints that the market’s buying interest is currently slowing down. The strength of the trend can be measured by traders by checking any changes to the MACD histogram.
Source: TradingView
Jupiter (JUP) Path to Sustained Uptrend
Jupiter will need to close above $0.63 every day to indicate that the breakout is real. Breaking above this level every day WOULD indicate the upward trend is still in force. Moreover, increasing volume in the breakout will make it more likely for prices to keep rising.
At the present time, Jupiter is encountering a key resistance wall. If the breakout takes place, it could let the price climb to $0.7359, $0.8239 and $0.9301. With RSI and MACD pointing up, the potential for a climb exists, but traders shouldn’t make any moves until they have more proof.
