Bitcoin’s Quiet Accumulation: Long-Term Holders Gobble Supply as Weak Hands Get Shaken Out

While Wall Street still debates Bitcoin’s ’intrinsic value,’ the smart money isn’t waiting—long-term holders are aggressively stacking sats during this consolidation phase. Meanwhile, leverage-happy day traders keep getting liquidated in what’s becoming crypto’s version of natural selection.
This isn’t your 2017 bull run. The current cycle shows a striking divergence: addresses holding BTC for 3+ years now control a record share of circulating supply, while exchange reserves hit multi-year lows. Translation? Diamond hands are vacuuming up coins from panic-selling tourists.
The institutionalization is here—just not the way CNBC predicted. Forget spot ETFs; the real story is cold wallets swallowing liquidity faster than BlackRock can file another amended S-1. And those ’Bitcoin is dead’ headlines? They’re the perfect cover for accumulation.
One cynical take? The ’dumb money’ always needs a narrative. Right now it’s obsessing over Fed rate cuts while the OGs quietly execute the oldest play in finance: buy when there’s blood (or boredom) in the streets.

- Because of the liquidations, those who had borrowed to trade Bitcoin short-term were removed, allowing those who held it long-term to add more to their holdings.
- A rise in long-term investors is seen in Bitcoin charts, demonstrating that the market is getting more confident.
- Strong engagement from buyers and sellers in the order clusters helps confirm Bitcoin’s support and remains bullish over time.
Lately, the Bitcoin market saw a significant change as those traders who had borrowed money to speculate on price decreases were forced out, allowing the long-term holders (LTHs) to take advantage and increase their investments. According to CryptoQuant analyst Amr Taha, this shift means there has been a major change in how the market behaves.
The value of bitcoin held by those who keep it for the long term has now climbed above $28 billion, revealing that investors who are used to market swings are still adding to their holdings.
Chart Shows That Long Positions Have Been Aggressively Wiped Out
The sharp fall was mainly caused by liquidations of traders who had borrowed a lot to buy bitcoin. The movement of the market against them caused many forced liquidations, which eliminated their positions.
You can see this on the “BTC: Binance Liquidation Delta” chart, which reveals where significant liquidation takes place. A red bar tells you that a short position was liquidated and a green bar means a long position was held.
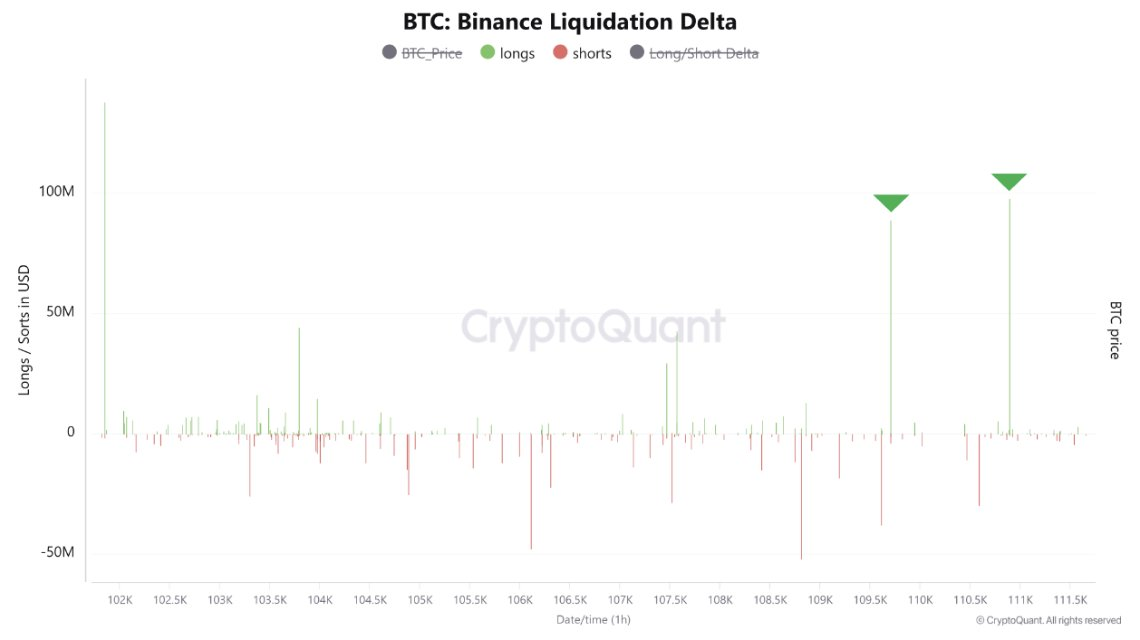
Source: X @cryptoquant_com
You can see a group of tall green bars NEAR the middle of the chart which means many long positions were closed quickly.
Bitcoin Chart Shows the Practice of Long-Term Accumulation
Long-term holders of Bitcoin are shown to be making more purchases on the chart, “BTC: STH LTH Net Position Realized Cap,” at the same time that short-term traders are selling. The colored areas on the chart illustrate the change in ownership each year between long-term and short-term investors.

Source: X @cryptoquant_com
While some have been trying to sell quickly, those holding for long periods have bought more, since prices are now lower after the recent sell-off. Even as the percentage of experienced BTC owners goes up, the price of Bitcoin has stayed relatively the same.
It proves that investors with a longer outlook feel secure, despite occasional ups and downs.
Buy-Sell Clusters Trends Say the Bitcoin Market Structure is Holding Strong
In the third chart, there are major clustering of buy and sell orders at various prices. From the chart, Bitcoin’s price is being compressed by a lot of trading activity, represented by horizontal bars in various colors. This implies there is a lot of activity on the asset.

Source: X @cryptoquant_com
