SEI Breaks Out: Bulls Charge Toward $0.30 as Neckline Resistance Cracks

SEI’s price action just flipped the script—bulls smashed through the neckline, and now $0.3000 is in play. No fluff, no hopium—just a clean breakout with a target that’ll either print gains or remind everyone why crypto charts and caffeine don’t always mix.
Technical traders are leaning in, but let’s be real: in a market where ’fundamentals’ sometimes mean ’Twitter hype,’ even the cleanest patterns can get rug-pulled. Still—for now, the bulls have the mic.

- SEI has confirmed a breakout from an inverse head and shoulders pattern, signaling a potential long-term trend reversal.
- The price is holding above the critical $0.2300 neckline, now acting as strong support backed by increased trading volume.
- SEI is trading above its 50-day EMA, reinforcing bullish momentum and attracting renewed investor interest.
- Price targets between $0.2900 and $0.3000 are in focus as traders anticipate a continuation of the breakout rally.
SEI is gaining upward momentum, breaking out from the inverse head and shoulders reverse setup after a steep downtrend. The price is retesting the neckline area now transformed into a strong support area. The breaking of this level could validate the reversal and open the doors towards a strong uptrend. Traders are monitoring this level closely; a successful retest can result in increased buying and more price momentum.
SEI is currently trading at a level of $0.2362 with a 24-hour volume of $115.31M and a market cap value of $1.25B. The Sei Price over the last 24 hours has been hit by market volatility and is down by 2.93%; over the last week it is stable, and over the last month, its price is up by 21.32% and showing signs of a strong trend reversal.
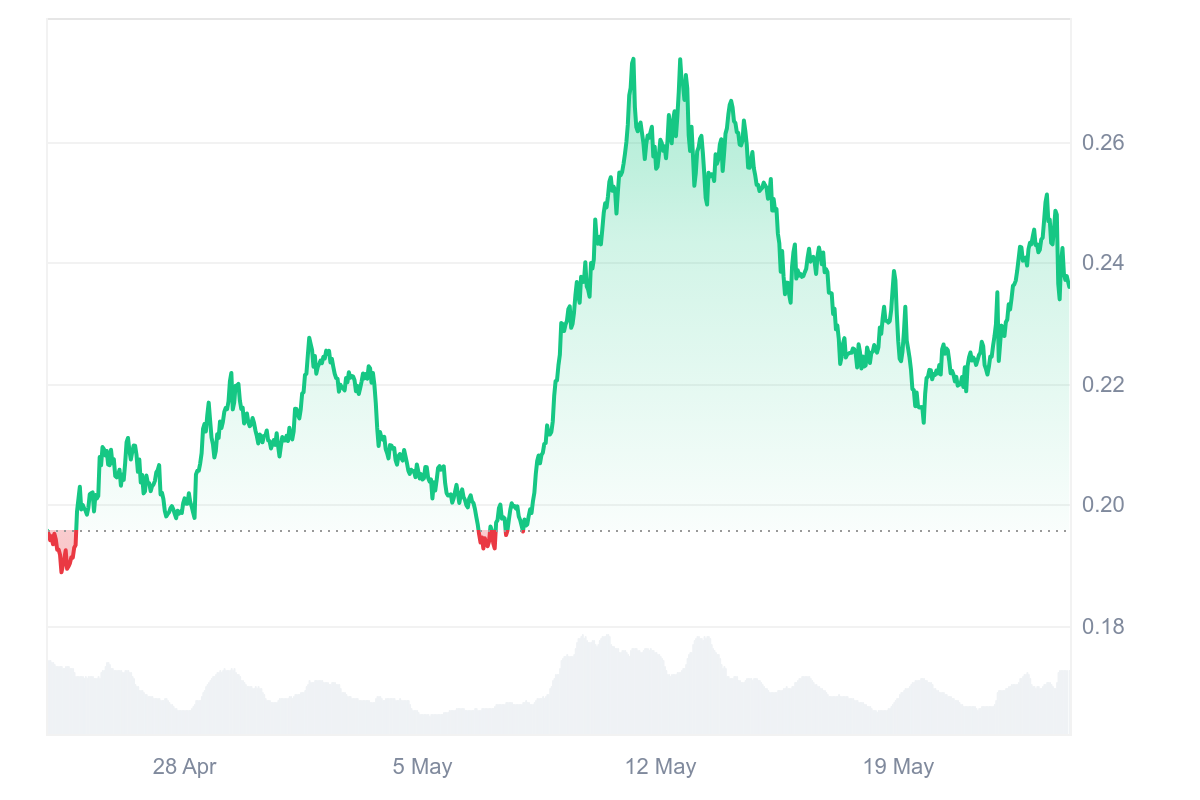
Source: CoinMarketCap
SEI Primed for Rally After Inverse Head and Shoulders pattern
A prominent crypto analyst suggested that after riding a prolonged downtrend, SEI seems to have reached a turning point from a technical standpoint. The asset has completed a textbook Inverse Head and Shoulders pattern on the daily chart, a classic reversal setup that tends to indicate the reversal of bearish momentum and the potential start of a new uptrend. This setup is well-respected across traders and analysts and indicates a change in market attitudes.
The breakout through the neckline resistance level at the $0.2300 level was not just technically important but also confirmed through increased trading volume, a very important confirmation for chart-based breakouts. The surge in volume is a sign of increasing conviction among participants and decreases the chances of a false breakout. SEI has maintained its position above this neckline, and this is now a very important support level.
SEI Eyes $0.30 Target After Solid Trend Reversal
Further confirming the positive outlook is the fact that Sei is trading over its 50-day Exponential Moving Average (EMA), a dynamic level commonly used to indicate medium-term trend strength. The breakout has continued to show strength, an encouraging sign of sustained buyer interest. This upward structure highlights that bulls are actively defending key support zones, stepping in during pullbacks, and gradually building momentum in favor of a continued rally.
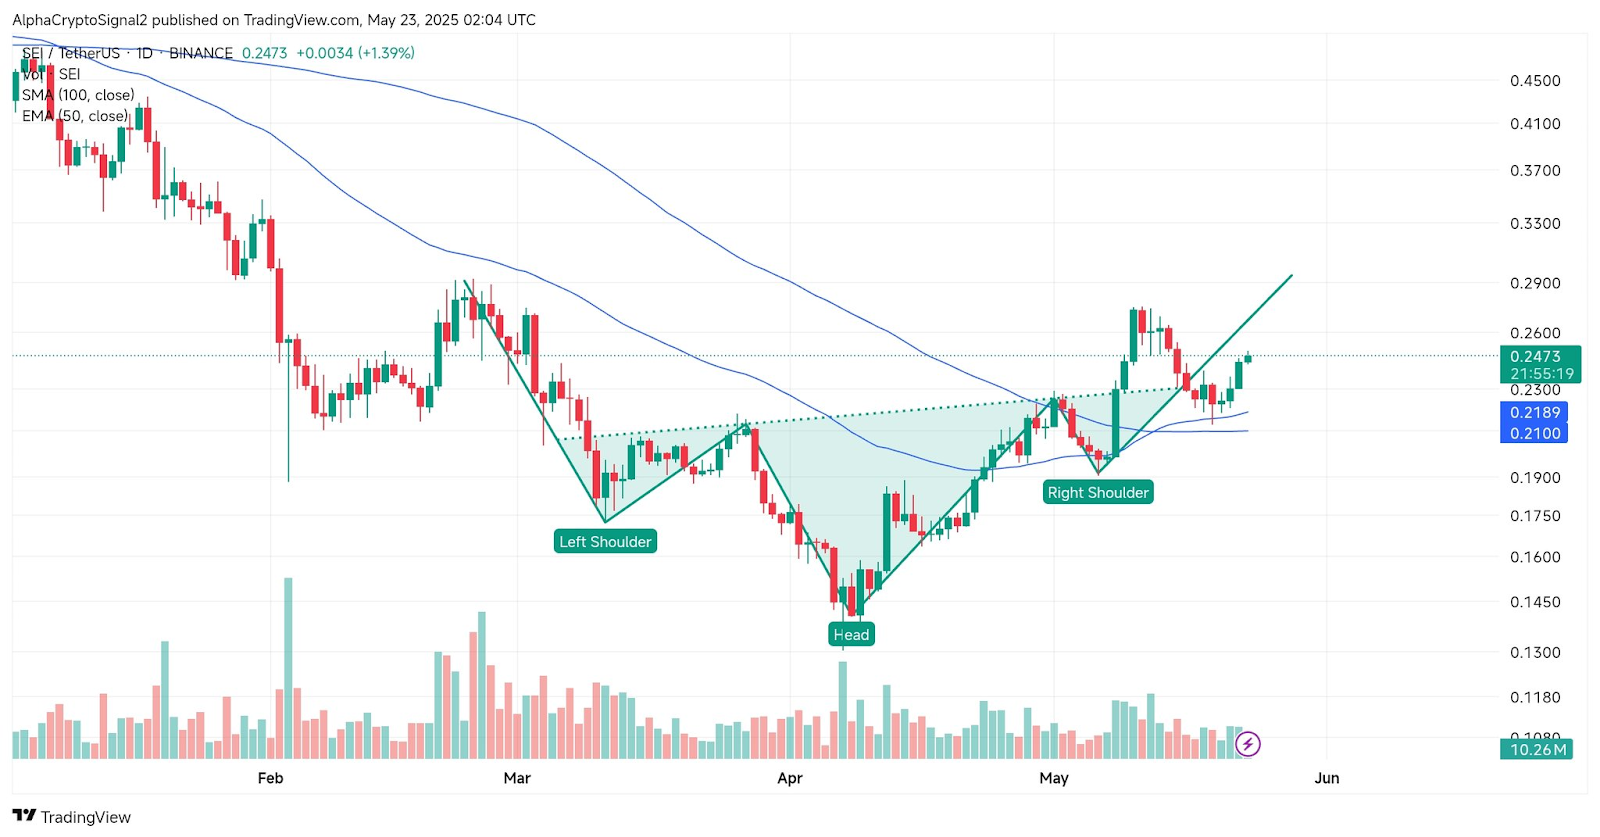
Source: X
Looking ahead, the projected upside, calculated from the bullish chart, suggests a potential price target between $0.2900 and $0.3000. If SEI holds its position over the neckline area, then the patterns of increasing volume remain supportive, and traders expect further upside pressure. Investors are currently waiting to see prices break through the past resistance levels to confirm the next leg up and potentially trigger a new stage of trend reversal.
Related Reading: Bitcoin Cash (BCH) Consolidates After Rally, Support at $415 Crucial for Next Move
