XRP/BTC Pair Flashes Bullish Signal—30% Breakout Imminent?

Crypto traders are eyeing the XRP/BTC chart as technical patterns hint at a potential surge. The setup suggests a possible 30% upside—if Bitcoin doesn’t decide to ’reassert dominance’ like a jealous central bank.
Key levels to watch: A clean break above the current resistance could trigger a cascade of algo buys. Meanwhile, skeptics whisper about ’2021 vibes’—because nothing says ’healthy market’ like hopium-fueled leverage.

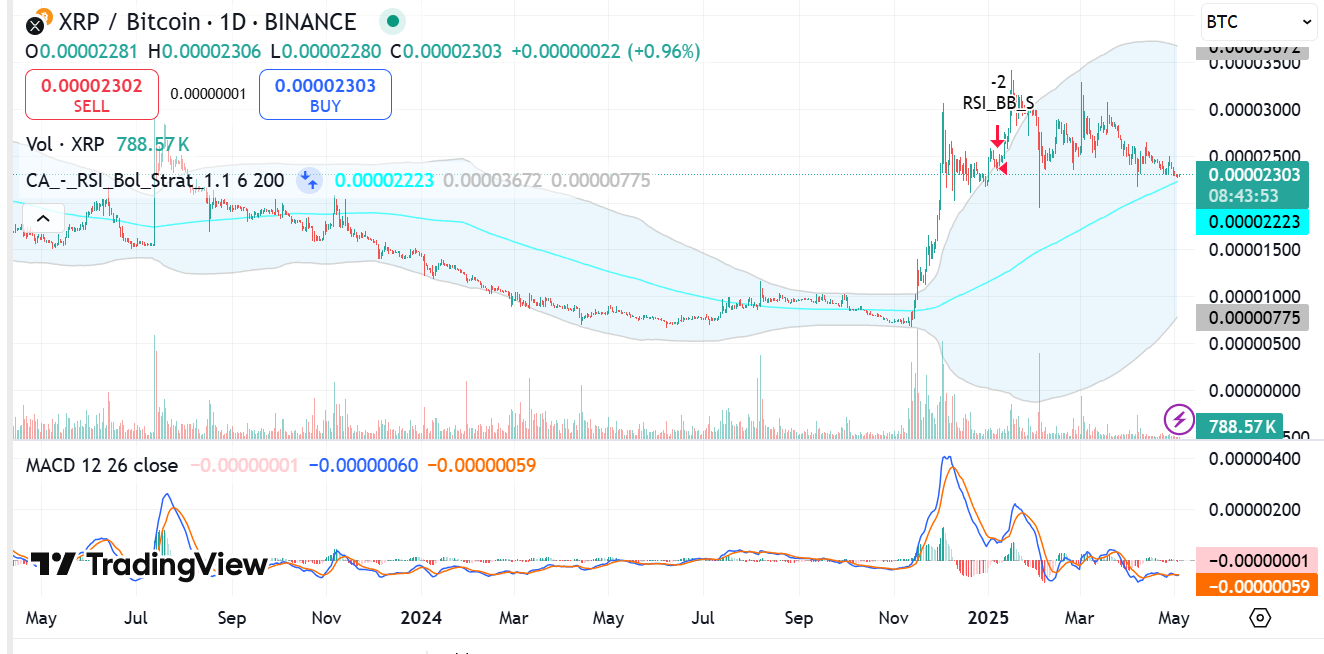
- XRP/BTC shows neutral Bollinger Bands but hints at a potential breakout, with a 30% rise possible if resistance at 0.00002700 BTC breaks.
- MACD lines are converging, suggesting a possible bullish crossover, while steady trading volume adds to the breakout watchlist.
- Price holding above the 200-day MA indicates long-term stability.
XRP, the cryptocurrency used by Ripple, currently trades at 0.00002303 BTC after gaining 0.96% in the last day, according to current TradingView data. Despite the small gains, traders wonder whether XRP is about to experience a larger breakout against BTC, possibly up to 30%.
A detailed analysis of the chart provides some possibilities. In recent months, XRP has displayed strong price uptrends, especially late last year when its price ROSE sharply.
While its price has dropped since then, it remained above the 200-day moving average. Traders use this moving average to have a better understanding of an asset’s long-term trends.
Generally, when an asset stays above this line, it suggests that it’s not in a downtrend. In some cases, it could be in a bullish phase.
Source: TradingView
Bollinger Bands Signal Neutral Zone
Another useful tool which traders use is the Bollinger bands, which appear clearly on the chart. These bands monitor price changes and pinpoint zones where a breakout may occur.
When price is close to the top band, it indicates that there’s a build-up of momentum and a significant move is about to happen. However, the current chart shows that XRP is NEAR the middle of the band, which suggests that it’s in a neutral region.
However, it also means that the price could move in the upward or downward direction at any time soon.
Is XRP/BTC Preparing to Rally?
An analysis of the MACD tool also provides further insights into possible price direction for the XRP/BTC pair. The MACD helps detect changes in momentum. Currently, the chart shows that the blue and orange lines are close together.
When the blue crosses over the orange line, it is a sign of a buy opportunity. The chart currently shows that the MACD hasn’t shown strong buy signs.
However, the blue line isn’t far from crossing over the orange line, suggesting that a shift in trend could happen soon. Also, trading volume is steady and not spiking.
The volume measures the number of XRP/BTC trades currently taking place. The higher the volume, the bigger the price change that could happen.
Hence, traders would be watching this volume closely to know when a breakout is about to happen. Meanwhile, analysts predict that for a 30% rise to occur, XRP must break out towards 0.00002700 BTC in addition to a strong MACD crossover and rising volume.
Related Reading |

Log in to Reply
Log in to comment your thoughtsComments
Related Articles
|Square
Get the BTCC app to start your crypto journey
Get started today Scan to join our 100M+ users