Render’s Market Reversal: Analyzing the Sustainability of Its Price Rally

As of April 2025, Render (RNDR) has demonstrated a notable bullish reversal after a period of consolidation, sparking debates among traders and analysts about whether the current uptrend can maintain its momentum. Technical indicators suggest strong buying pressure, but market participants are closely monitoring key resistance levels and on-chain metrics to gauge the potential for continued appreciation. This analysis delves into the factors driving Render’s recent performance, including network adoption, GPU rendering demand, and broader crypto market sentiment, providing a data-driven perspective on its near-term trajectory.

- Render’s chart shows a potential five-wave upward move, signaling a possible reversal from the April 7th low.
- A higher low in the upcoming pullback is needed for confirmation, or it may be just a temporary bear market rally.
- Key support for Render’s recovery lies between $2.80 and $3.47; a break below could signal weakness and further declines.
The price chart of Render indicates a possible five-wave upward movement and is currently recovering from its low on April 7th. The structure seems to be rather impulsive, which points to an extraordinarily large wave that may signify the reversal of the prior trend. This has confounded earlier projections that wave B would form a triangle, which would have been the first indication that Render might have reversed and found its bottom.
Wave 2 Confirmation
To confirm the low, Render must establish a higher low during the upcoming pullback, referred to as Wave 2. Without this confirmation, there is always the possibility that the rally is just a C-wave temporary bear market rally. If it is the case, there is also the possibility of transition to the levels below it.
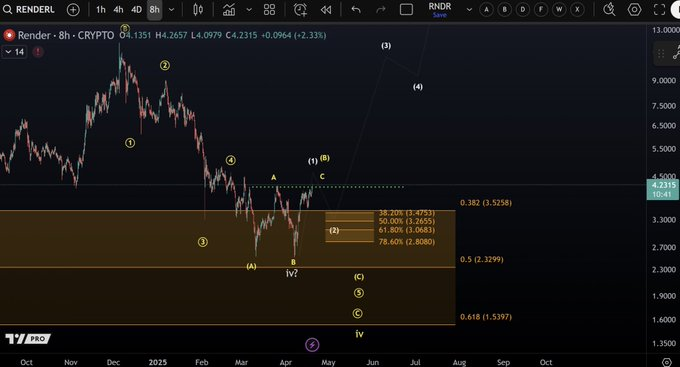
Source: X
The analyst also pointed out the vital levels to watch when the price bears a reversal pattern during the subsequent pullback. This conjecture holds based on the notion that critical support for wave 2 lies in the range of $2.80 to $3.47. For the recovery to begin, the price of Render needs to be stable higher than those levels. A break below this support band would indicate that the market is weak, and this would likely lead to a further selloff.
Although the bounce from the defined support zone is positive, More Crypto Online made a note that the market remains volatile. The next pullback will be important in determining the sustainability of this recovery stream. In this case, therefore, if Render is unable to break the higher low, the recent recovery could easily be cut short, and we may see further selling pressure in the market.
Render’s Prolonged Rebound Potential
However, if those levels remain intact and Render further consolidates itself in the given zone, there will be more grounds for a more protracted rebound. If the price bounces from these support zones, it will indicate an upward trend in the long term. On the other hand, these support levels can also falter, causing the rally to reverse and hence a further drop in prices. As of press time, RENDER is trading at $4.23, showing an 8.09% increase over the past day.
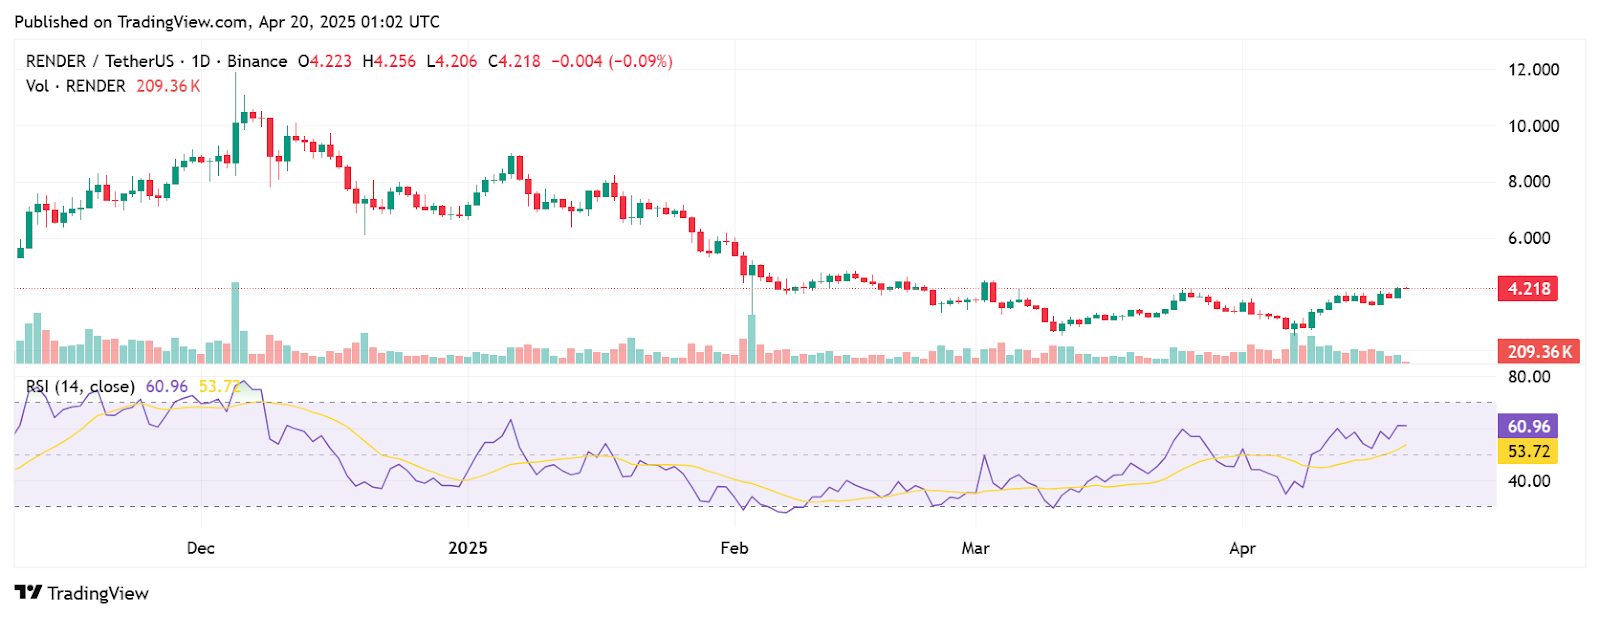
Source: TradingView
The promising data from Render analysis points toward market recovery, but the circumstances require additional time to indicate a complete shift in direction. Market participants should exercise continued caution as they monitor the upcoming price movements in the market. The upcoming few days will determine whether this movement represents an extended bullish phase or is part of an overall negative trend.
