Ethereum’s Falling Wedge Pattern: Will Bulls Overcome the $2,000 Barrier?

As of April 19, 2025, Ethereum (ETH) is exhibiting a classic falling wedge formation on its daily chart—a technical pattern often signaling potential bullish reversals. Traders are closely monitoring whether ETH can muster enough momentum to breach the psychologically significant $2,000 resistance level. The current consolidation follows a period of downward pressure, with the narrowing price range suggesting weakening bearish conviction. Market analysts note that a confirmed breakout above the wedge’s upper trendline, accompanied by rising volume, could validate the pattern and target higher resistance zones. However, failure to hold above $2,000 may see ETH retest recent swing lows. The coming sessions will prove critical in determining whether this technical setup marks a reversal or continuation of the current trend.

- Ethereum is trading at about $1,597, with a market cap of $192 billion and trading volume of $7.03 billion.
- ETH tests major support at $1,500–1,600 range with early bullish divergence indicators.
- Analysts predict Ethereum may break $2,000 if it holds above $1,600, targeting $2,150.
Ethereum (ETH) has hovered at about $1,597 over the last three days, indicating that its price has stabilized. Despite this, the large-cap altcoin is still battling against a strong bearish downtrend, with a fully diluted market valuation of approximately $192 billion. Its 24-hour average trading volume of $7.03 billion highlights the ongoing market interest.
ETH Tests Critical Support in $1,500–1,600 Range
Technical analysis suggests that Ethereum is testing critical macro support within the $1,500–1,600 range, forming a descending channel. The Relative Strength Index (RSI) is showing early signs of bullish divergence, indicating the possibility of a rebound. Higher lows are forming while the price continues to decline, a pattern often seen before potential price recovery.
The current support level is crucial, as it marks the point that sparked Ethereum’s rally in 2023. When Bitcoin dominance drops, it can be one of the first large-scale cryptocurrencies to react positively. A reclaim above the $1,700–1,800 level would be an indicator that the upward momentum of ETH continues, reflecting an even stronger trend.
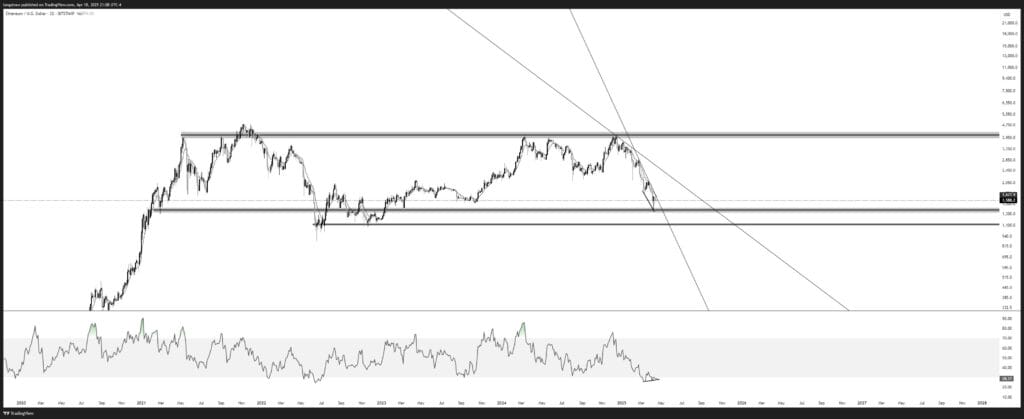
Ethereum’s chart shows an ongoing bearish downward trend since last year’s high at $4,100. The cryptocurrency is trading below both the 50-day and 200-day Exponential Moving Averages (EMAs), indicating weak market sentiment. However, there are positive signs as well. Ethereum has formed a bullish divergence, with the MACD lines rising and the RSI moving slightly above its descending trendline. Additionally, ETH has formed a falling wedge pattern, indicating a potential bullish breakout as the two trendlines converge.
Is Ethereum Set for a Bullish Breakout Soon?
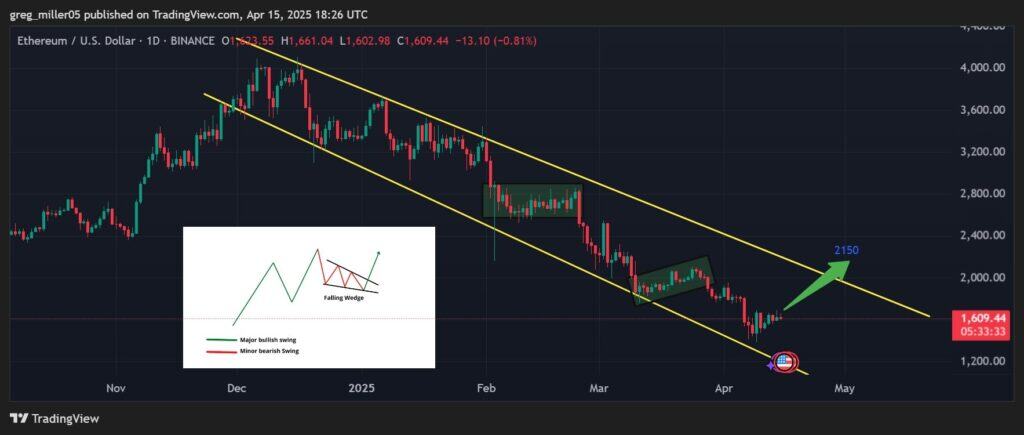
Market analysts have provided optimistic comments about the recovery of Ethereum’s price. According to Greg Miller, the breakout of ETH from the falling wedge may be followed by an increase of great magnitude up to $2,150. In case ETH breaks past this level, it may indicate the start of the crypto’s next move up.
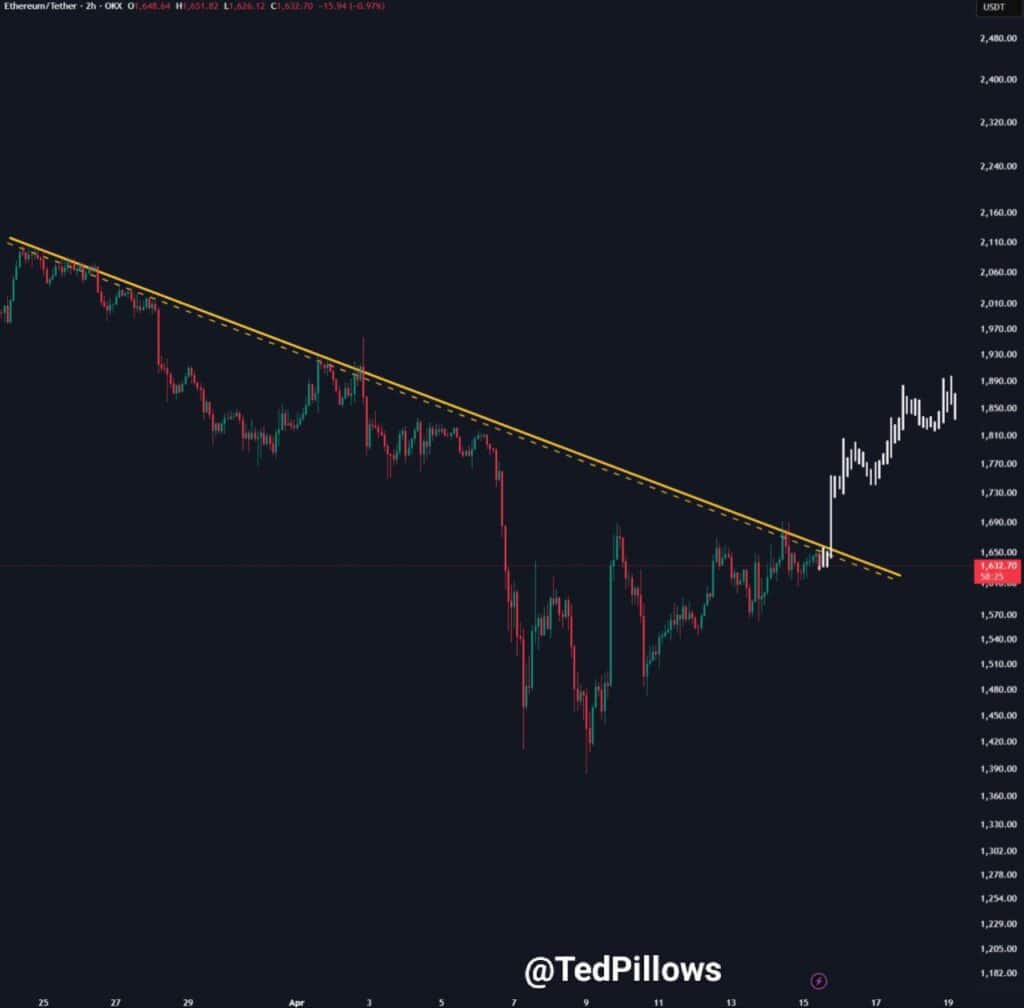
Ted Pillows commented that the cryptocurrency needs to sustain the $1,550–1,600 zone to have an opportunity to recapture the $1,670 high. If successful, a rally towards $2,000 could follow. However, ETH remains in a highly competitive landscape, and its ability to overcome the challenges posed by layer-2 networks and declining ETF inflows will determine its future performance.
Read More: Ethereum Faces Extreme Fear: Is Now the Time to Invest for Massive Gains?
