SEI Primed for $0.40 Breakout as Macro Buy Signal Ends Consolidation Phase

SEI shakes off sideways boredom—bulls charge toward $0.40.
Macro buy signal flashes green: The crypto winter thaw accelerates.
Technical breakout or fakeout? Traders place bets while VCs cash checks.

- SEI is currently trading at $0.175, with RSI recovering from oversold, showing early strength.
- The volume confirming stability as OBV remains steady, pointing at quiet accumulation.
- A breakout above $0.19 could push SEI toward $0.22 to $0.26 range.
The Sei Network (SEI) is a fast and highly performant LAYER 1 blockchain that is specifically built for trading applications with fast finality and built-in order matching. This has gained traction as a DeFi-focused ecosystem coin and is expanding to a larger investor focus across several major exchanges. The coin is currently trading at $0.175, up around 2% in the past 24 hours.
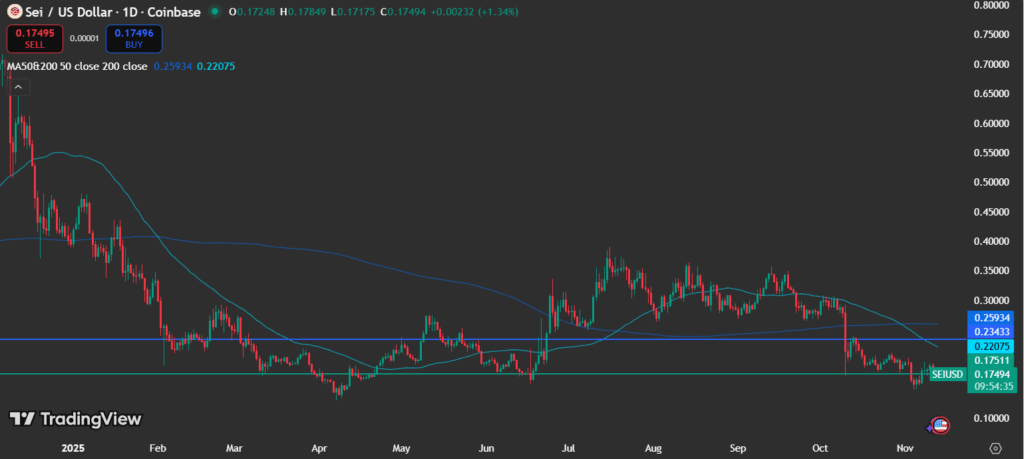
SEI Continues To Hold $0.17 Support
The one-day chart from TradingView shows that the coin has been trading in a tight range. The price is currently still above $0.17, which has been a strong historical level of support being observed since mid-2025. While the 50-day and 200-day moving averages still trend downward, suggesting the overall trend has not yet reversed. The price stabilising at a level of support is indicative of a consolidation or local bottom.
A daily close at or above $0.19 WOULD be the first indication that its consolidation range has started to break out. The first resistance at this point in the sequence lies at $0.22, followed by around $0.234, then about $0.26. The pattern suggests that it may be starting to accumulate ahead of a stronger move to the upside, as buying pressure may increase.
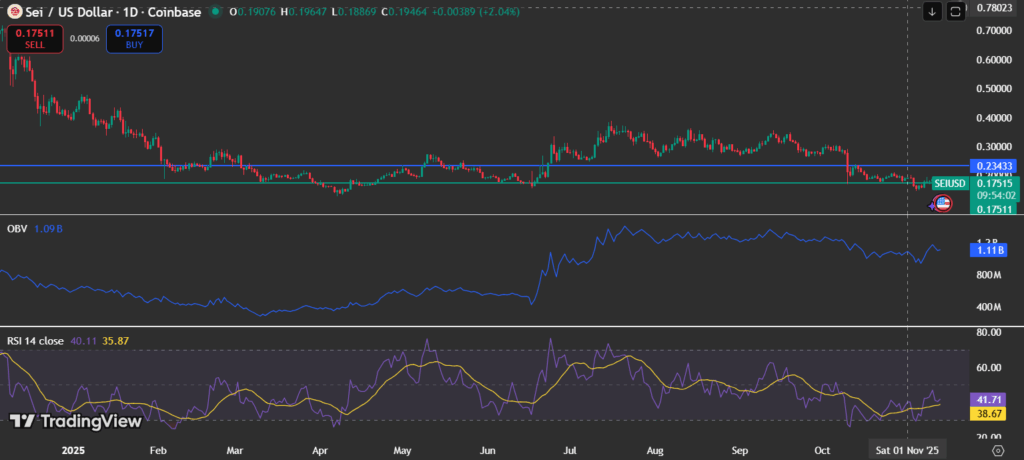
RSI and OBV Signaling Accumulation
According to the chart from TradingView, the RSI (14) had climbed from around 35 to 41, indicating that bearish momentum may be weakening and buyers are beginning to gain control. A MOVE above 50 RSI would further strengthen short-term bullish momentum.
In the meantime, the On-Balance Volume (OBV) indicator is relatively flat around 1.1B, suggesting that volume inflows are starting to exceed volume outflows, a classic signal of accumulation.
Overall, the combination of both indicators provides an early recognition of bullish momentum, even before the moving averages confirm a defined trend change.
Ali Charts Flags TD Sequential Buy Signal
According to crypto analyst Ali Martinez the coin is in a step for the next breakout.
“$SEI expanding to more investors is BULLISH. Especially, as it could be nearing the end of its consolidation phase, with the TD Sequential flashing a macro buy signal.”
We’ve also seen the TD Sequential buy signal. This is the calm before the next leg up. This aligns with current technical signals showing stability, accumulation, and upward bias in both price and momentum indicators.
$SEI expanding to a wider investor base is BULLISH!
Especially, as it could be nearing the end of its consolidation phase, with the TD Sequential flashing a macro buy signal.
This looks like the calm before the next leg up. https://t.co/P0XxJMqspc pic.twitter.com/mcUlclsBWW
In summary, with the coin continuing to hold its $0.17 support, RSI improving, and OBV flat, the technical backdrop is moderately bullish. If the coin breaks above $0.19, it could spark a rally towards $0.22 – $0.26, which would confirm the onset of a trend reversal phase.
