Jupiter (JUP) Primed for Breakout: Descending Triangle Targets $1.26 Surge

JUP's chart flashes a classic bullish signal—traders ignore it at their peril.
Descending triangle patterns don't lie. Jupiter's consolidation phase screams accumulation, with whales quietly loading bags before the breakout. The $1.26 target isn't hopeful speculation—it's technical inevitability.
Meanwhile, legacy finance still thinks 'crypto winter' is permanent. Their loss.

- Jupiter’s price is consolidating near the $0.35 support level, hinting at potential stabilization before the next move.
- Technical indicators show mild bearish pressure with the RSI at 41.64, hinting at potential stabilization.
- A break above the compression zone could target $0.45, $0.60, $0.76, $0.87, $1.00, $1.15, and $1.26 in the near term.
Jupiter (JUP) is showing resilience in its price trajectory, showing a slight surge in its overall market value. Over the past 24 hours, JUP has gained nearly 1.17%, although it has experienced stability when considering its performance over the last seven days.
At the time of writing, JUP is trading at $0.3566, with a 24-hour trading volume of $38.56 million, remaining relatively stable over the past 24 hours. Its total market capitalization stands at $1.14 billion, indicating investor interest and engagement in the token.
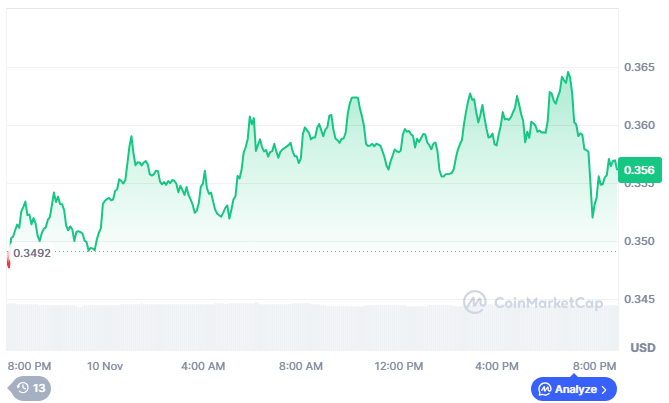
Source: CoinMarketCap
Also Read: Jupiter at a Crossroads: Will Support Zones Trigger a Major Reversal?
Jupiter (JUP) Hints Consolidation Before Upside Move
The Jupiter (JUP) chart shows after peaking around $0.55 in late July, the price entered a prolonged downtrend with sharp declines, including a mid-October spike down. Currently trading NEAR $0.356, just above the lower Bollinger Band at $0.3008, the market appears to find some short-term support while moving toward consolidation.
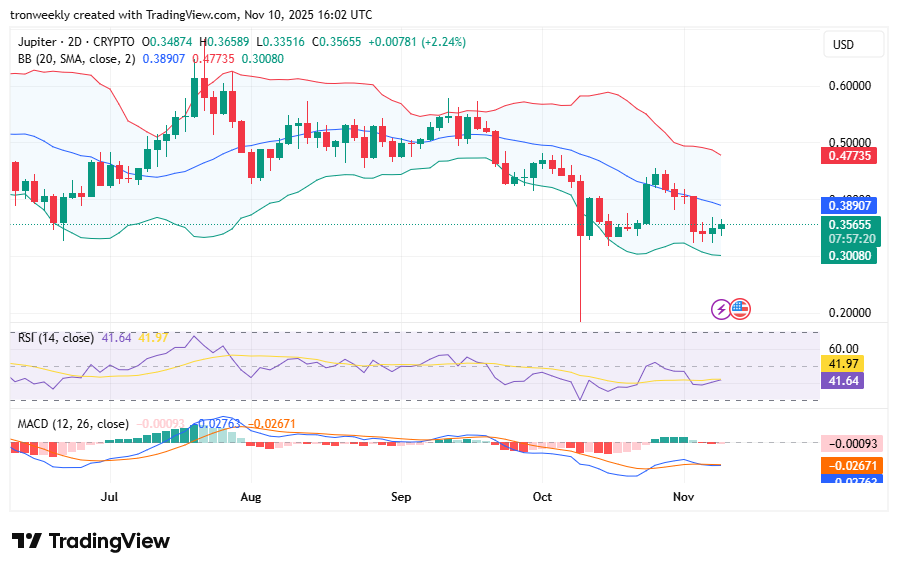
Source: TradingView
The value for the RSI is 41.64, which is below the midline, suggesting slight bearish momentum but not to the extent that it’s considered oversold.
The MACD is exhibiting a scenario where the signal line is above the MACD line with slightly negative bars on the histogram, suggesting that even though there’s a bear market, it’s weakening. The market is indeed in a position where it’s going through a consolidation phase following a strong bear market.
Jupiter Targets $1.26 as Descending Triangle Plays Out
Moreover, the crypto analyst, Jonathan Carter, revealed that Jupiter (JUP) is now holding above the lower boundary of this descending triangle on the 2-day chart. This is a sign of a compressed period during which price is building towards a critical point. At this point, traders are waiting to see which way it will break.
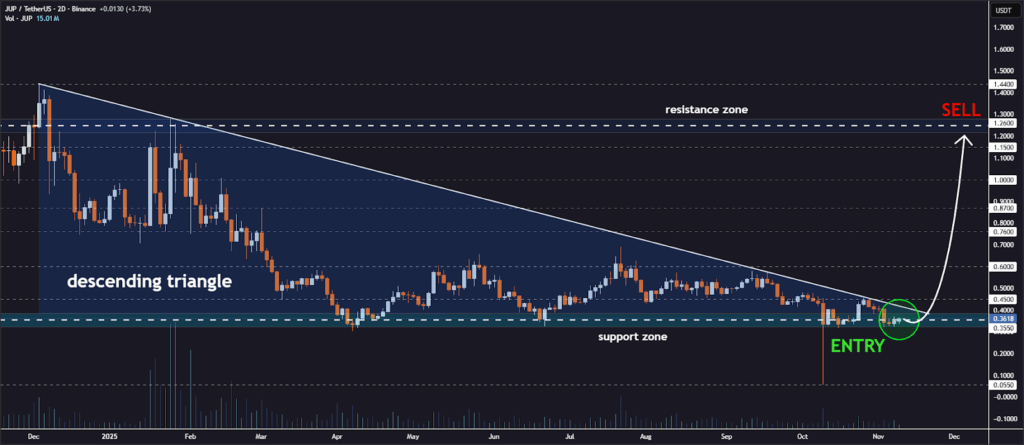
Source: X
If a successful breakout is achieved through this compression zone, it might push the price towards significant levels of $0.45, $0.60, $0.76, $0.87, $1.00, $1.15, and $1.26. Each one of these levels might act as a point of interest for traders, where momentum might accelerate or rest. The outcome has a significant effect on the short-term price action for JUP.
The market’s attention is on this critical point because the point where the descending triangle touches is a moment that represents a make-or-break scenario. The market’s behavior in coming sessions will clearly show if there is enough bull pressure for a breach above or if enough bear pressure will be generated for it to test lower levels.
Also Read: Jupiter (JUP) Poised for Breakout: Can It Reach $0.4985 Soon?
