SEI Price Explosion: Buy Signal Ignites 30% Rally—Will It Shatter the ATH?

SEI's chart just flashed its most bullish signal in months—and the market responded with a 30% surge. Now traders are asking: Is this the breakout that finally topples its all-time high?
Here's what the technicals scream:
- The buy trigger hit as SEI broke through a multi-week resistance level
- Volume spiked 300% above average during the breakout
- Shorts got liquidated at the fastest rate since the June rally
But let's not pop champagne yet. The last 30% pump could just be hedge funds front-running retail FOMO—again. Remember: In crypto, 'buy signals' often mean 'sell opportunities' for the whales.

- SEI is now trading at $10.1865 with a 5.27% increase, showing a bullish momentum.
- The coin has surged nearly 30% after confirming a buy signal, with indicators (RSI, MACD) highlighting bullish strength.
- On-chain data shows the coin gaining strength, even though it is far from its $1.14 ATH, and the momentum hits a steady increase.
Sei (SEI) is the Layer-1 blockchain that is built to power fast and efficient transactions, and has now entered a bullish phase. After weeks of sideways movement, the token confirmed a buy signal, which hints at a possible comeback and positions it for a potential retest of its previous highs. The coin is trading at $10.1865 with a 5.27% increase over the past 24 hours.
$SEI Buy Signal Has Confirmed!
According to the recent update on X by the crypto analyst Ali Martinez, the coin has confirmed a buy signal. As he shared, the coin has an increase of nearly 30 %, and it’s going to enter a bullish phase. This signal was noted by the analyst last week, and now it’s validated.
Buy signal confirmed. $SEI up 30%! https://t.co/cqSoY3jaWI pic.twitter.com/kWNsK1xG2a
— Ali (@ali_charts) November 10, 2025The Daily Chart Shows A Bullish Trend
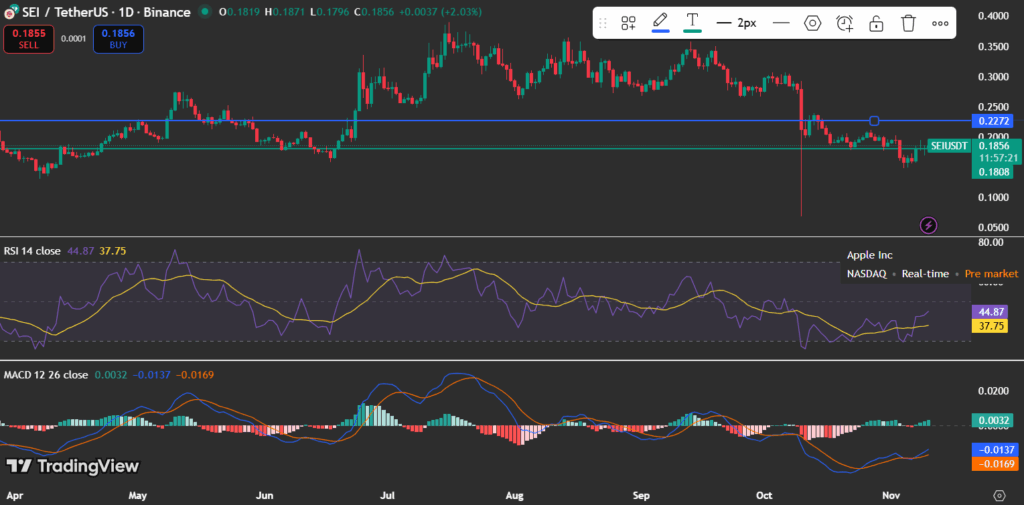
According to the data taken from TradingView shows that the coin is holding firm above its $0.15 support level. This is the main key level that validates the breakout pattern. The RSI is at 44.87, showing oversold conditions. The MACD turning positive suggests early bullish crossover signs.
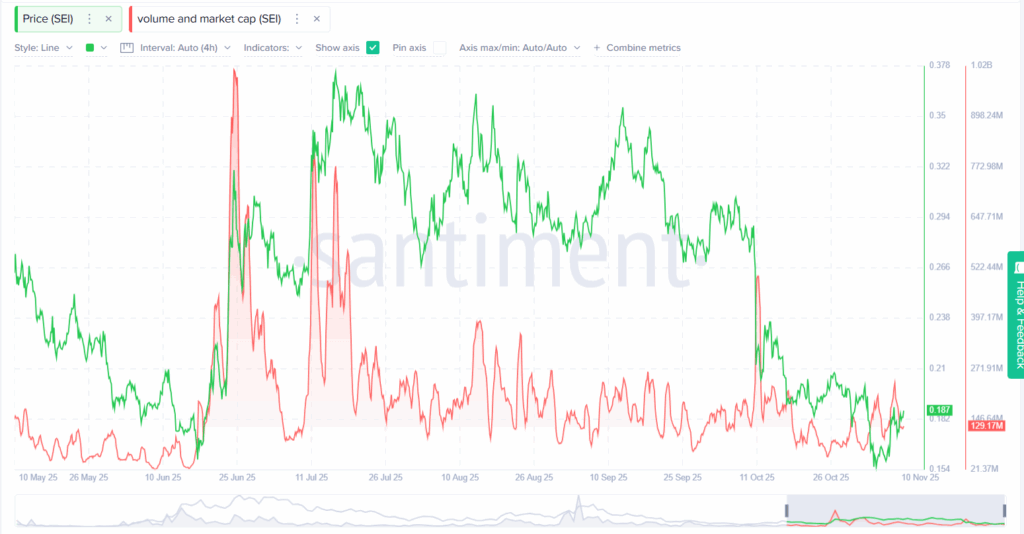
On-Chain Activity Supports The Momentum Growth
The Santiment data reveals a steady increase in the coins’ on-chain trading volume and network activity. This increased activity is a positive sign that supports the price rally. This rising transaction can lead to an accumulation by the market participants.
In conclusion, with the technical indicators showing recovery signs and rising on-chain participation, SEI’s trend overall looks bullish. The token holds support above $0,18 and breaks the $0.23 -0.25 resistance; the momentum might drive it closer to its ATH $1.14. This can mark a potential comeback phase for SEI.
