Bitcoin (BTC) Braces for Turbulent Correction—But $90K–$110K Target Still in Play

Bitcoin's bull run hits a speed bump as traders navigate choppy waters. The king of crypto isn’t dead—just catching its breath before the next leg up.
Why the dip won’t kill the rally
Markets love drama, and BTC’s current pullback is just another act in the 2025 bull cycle. Corrections shake out weak hands while smart money accumulates.
The $90K–$110K magnet
Like clockwork, Bitcoin’s price memory kicks in. These levels aren’t random—they’re where institutional FOMO meets miner profit-taking (and where Wall Street ‘discovers’ crypto… again).
Pro tip: When analysts say ‘complex correction,’ it means ‘we have no idea but want to sound smart.’ Buckle up—volatility is the price of admission.

Bitcoin has entered a short-term Wave II correction phase, marking a period of price adjustment after its recent rally. Market expert Darkfost explained that corrective waves often retrace about 50% of the prior upward movement, which puts a key support zone NEAR $96,800.
Currently, Bitcoin is consolidating around the 1.618 Fibonacci extension level of Phase A, a sign that the ongoing Wave C might stretch further before completion.
According to Darkfost, on-chain indicators show persistent uncertainty among traders. Selling pressure from long-term holders continues to restrict Bitcoin’s rebound strength.
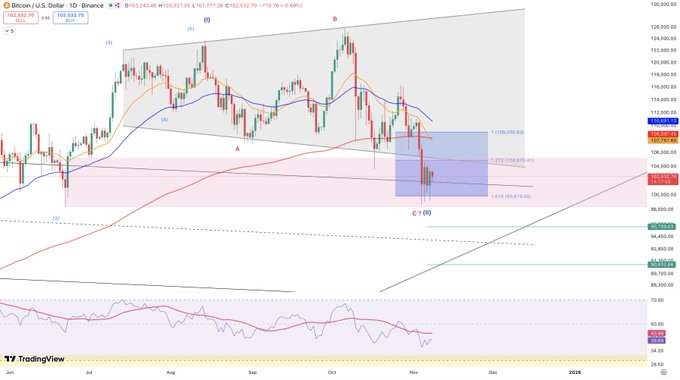
The daily RSI has slipped below 50 and may decline further before stabilizing in a previously tested rebound area. With momentum staying clearly bearish and no visible divergence, Bitcoin’s short-term outlook remains fragile.
The daily exponential moving averages (21 and 50 EMAs) are trending downward and nearing a cross below the 200 EMA, a sign of technical weakness. This region between $107,500 and $110,500 is shaping up as a major resistance area that must be reclaimed for bitcoin to show genuine signs of a bullish turnaround.
Bitcoin Price Possible Range Between $90K and $107K
In the short term, Bitcoin can see some volatility as it remains under the weight of selling. The price can consolidate in the $95,000 region or even touch $90,000 levels before stabilizing. Resistance at higher levels is at $107,000.
Despite the persisting correction, the long-term configuration remains in place. Bitcoin has found some temporary support around the 50 EMA levels, while its RSI, despite undergoing some corrections, remains near the neutral zones.
In the next two weeks, it is possible for BTC to attempt a recovery to cover the deviation gap formed in the last fall. But if the RSI goes further below 50, it could indicate the onset of a transformation in the long-term momentum, which could point towards deeper consolidation.
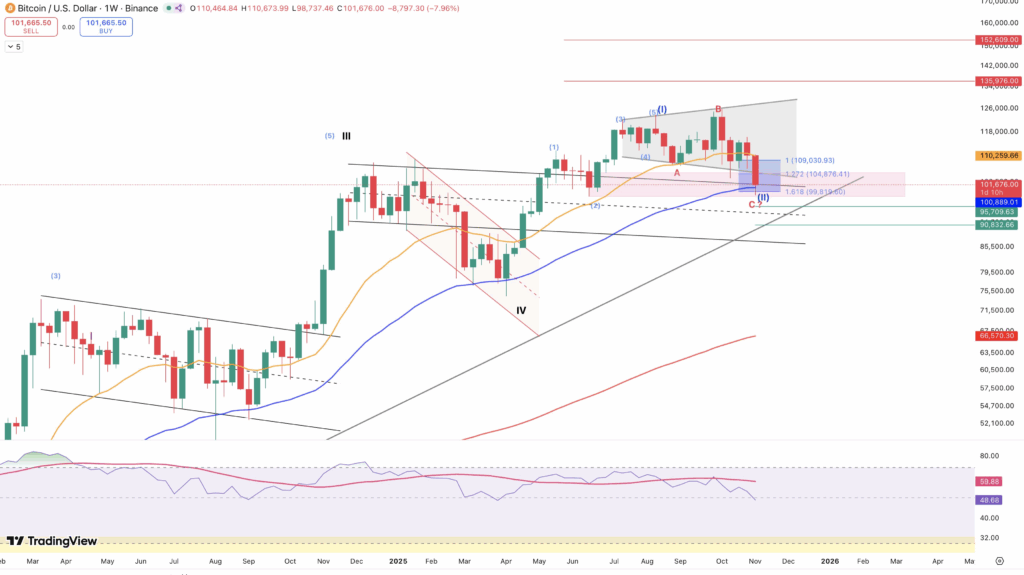
Diverging Views Among Experts
Market analyst Haejin noted that the current formation could be a part of a WXY correction pattern, where the market is presently working on wave C of Y. Since wave C always has five subwaves, but only four have been completed, he predicts one more lower low to follow a return towards $109,000.
In contrast, Darkfost did not agree, saying it is an ABC correction on the daily chart. He also thinks the final part of wave C is not completed, though he does not think the wave WOULD be a complex WXY pattern at this point. Both analysts were unanimous about corrections being a period of uncertainty, which never remains static.
We’re not looking at the same timeframe, but personally I’m still considering this as an ABC correction on the daily.
A WXY correction is essentially a double ABC connected by an X wave. It’s a more complex structure, and I don’t think that’s the case here, at least not on the…
