Ethereum’s Bearish Pennant Breakdown: $2,380 Target Looms as Technical Pattern Signals Further Decline

Ethereum's technical structure just flashed a critical warning signal—the bearish pennant formation has officially broken downward, putting the $2,380 price level squarely in the crosshairs.
Technical Breakdown: What This Pattern Means
The pennant's consolidation phase represented nothing more than a temporary pause in the prevailing downtrend. Now that ETH has sliced through the pattern's lower boundary, the measured move projection points directly toward that $2,380 target. Trading volumes spiked during the breakdown—confirming the bearish conviction behind this move.
Market Psychology: Fear Versus Greed
Traders who bought the consolidation now face mounting pressure as stop-losses cluster around key support levels. Each failed bounce creates another wave of selling—classic capitulation behavior that fuels these technical breakdowns. The $2,380 level represents more than just a number—it's the last major defensive line before ETH tests significantly lower territory.
Institutional Response: Watching the Whales
Large holders aren't panicking yet—but they're definitely watching. The smart money knows these technical patterns often become self-fulfilling prophecies in crypto markets where retail traders outnumber fundamental analysts ten-to-one. Another day, another chart pattern determining billion-dollar market moves—because who needs fundamentals when you've got pretty lines on a screen?
The path of least resistance now points downward until Ethereum can reclaim key resistance levels. That $2,380 target isn't just a possibility—it's becoming a probability.
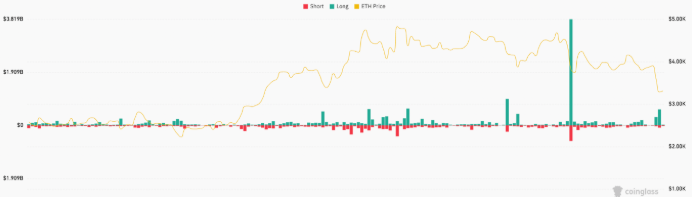
- Ethereum’s price drop led to over $484.5 million in long ETH leveraged positions being liquidated, contributing to the downward pressure.
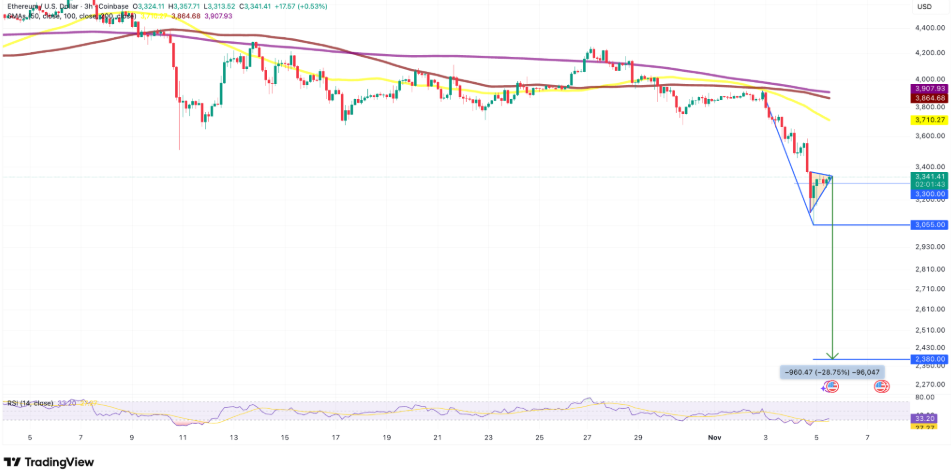
- ETH/USD has formed a bearish pennant pattern, indicating a potential further decline to $2,380 if the price breaks below the current support level of $3,300.
- Ethereum’s upside remains intact if the price stays above $2,800-$3,000, but a decisive close below $3,000 could lead to a deeper correction.
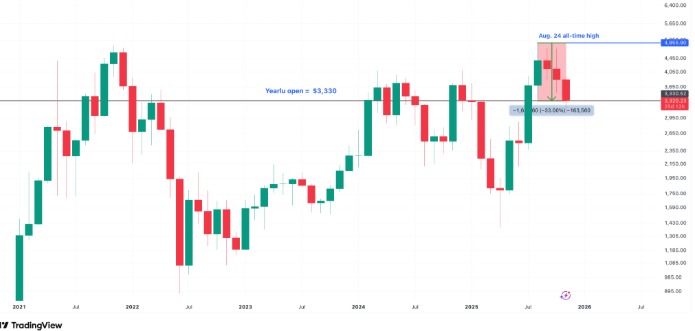
Ethereum’s price is not without a major stumble. It erased all of its 2025 gains and led to a wave of sell-offs in the market. The crypto went on to hit its lowest point at around $3,050, but it has since come back up to the vicinity of $3,300. This plunge has caused more than half a billion dollars (over $484.5 million) worth of long ETH Leveraged positions to be liquidated.
Risk-Off Behavior and Liquidations
The current situation with the vigorous sell-off is mainly due to risk-off behavior of derivatives traders. The description is in line with the data provided by CoinGlass and the report claims that in the last 24 hours, more than $1.7 billion worth of crypto positions with leverage have been liquidated, with about $1.3 billion of that being long liquidations. The single largest liquidation order happened on the Hyperliquid decentralized exchange. It involved the ETH/USD pair, which was worth $26 million.
Technical Analysis
Technically, ETH/USD has just about completed the formation of a bearish pennant pattern, which is a downward continuation setup, indicating that the price could MOVE further down. The critical area around $3,300 is the current support level of the pennant.
If the price falls through here, it is quite possible for it to head towards $2,380 (a 29% decrease from the present level). On the other hand, the relative strength index (RSI) has gone up to 33. Thus, the current recovery may last much longer than is generally expected.
Key Support Levels
Contrary to the downturn prediction, some analysts are still of the opinion that the price action of ethereum can only be considered bullish if the price remains above the range of $2,800-$3,000.
Daily candlesticks closing above the resistance level at $3,400 may allow Ether’s price to ascend to the 50 SMA at $3,700 and later on to $4,000. On the other hand, if a decisive close below $3,000 is observed, that WOULD indicate the possibility of a deep correction.
Conclusion
After the plunge of Ethereum’s price, investors started to worry about their investments in the crypto market. But, the upside potential of the cryptocurrency is still there as long as some of the essential support levels continue to stand firm.
The Bears’ pennant pattern, coupled with risk-off behavior among derivatives traders, points to the likelihood of forthcoming declines. Nonetheless, reclaiming levels beyond $3,400 could be the turning point for a rebound. In a market that is still very volatile, investors will be taking stock of the situation and looking out for either an imminent rebound or another drop.
