XRP Repeats 2017 Pattern - $27 Breakout Imminent as Charts Scream Bullish

History doesn't just rhyme - it's screaming from the cryptocurrency charts. XRP's current trajectory mirrors its legendary 2017 run with uncanny precision, setting the stage for what could become one of crypto's most explosive rallies.
The Technical Blueprint
Identical accumulation patterns, matching volume surges, and parallel resistance breaks - the 2017 playbook is unfolding again. Technical analysts point to the same Fibonacci retracement levels that preceded XRP's historic climb, with momentum indicators flashing green across timeframes.
The $27 Target Zone
Market technicians project a clean run to $27 based on measured move calculations from the 2017 cycle's structure. The target represents a perfect storm of technical confluence: previous all-time high extensions, psychological resistance levels, and wave theory projections aligning simultaneously.
Institutional Catalysts Brewing
While retail traders chase the next shiny token, smart money positions accumulate in plain sight. Regulatory clarity developments and banking integration pilots create fundamental tailwinds that technicals alone can't capture.
Remember when your financial advisor said crypto was a passing fad? XRP's potential $27 breakout would represent a 5,000% gain from current levels - enough to make traditional portfolio returns look like rounding errors.
- The price of XRP is $2.58 with market cap $155.08 billion and dominance of 4.06%.
- Analysts are targeting the $27 breakout level while XRP follows the same pattern it showed in 2017.
- The breakout above $3.30 might unleash a parabolic move, eyeing $10 to $27.
XRP’s price is showing steady strength despite recent fluctuations, currently trading NEAR $2.60. The long-term market structure of the asset indicates that it is on the verge of a significant move in the wake of consolidation between $3.30 in 2017 and $1.96 in 2021.
Currently, XRP is trading $2.58, with a trading volume of $8.10 billion in the last 24 hours and a market valuation of $155.08 billion, and it enjoys 4.06% market dominance. The coin has registered a slight decrease of 1.21% in the last day.

Key Resistance at 2017 Peak of $3.30
Ripple’s price movement reflects a clean and developing technical setup. The token is stuck in the re-accumulation range on the long-term charts, ranging between the $3.30 resistance level seen in 2017 and the $1.96 support level reached in 2021.

This consolidation region marks a key turning point for investors watching for the next major market direction. Analysts continue to suggest that it appears that XRP is growing in maturity in preparation for the next big market MOVE is upward or downward.
XRP Awaits the Next Parabolic Wave
Market analyst ChartNerd highlighted that XRP’s ongoing structure resembles its 2017 cycle, suggesting a familiar setup that once led to a blow-off rally. The analysis points toward Fibonacci extension levels, with potential upside targets near $10 at the 1.618 level and $27 at the 2.0 extension.
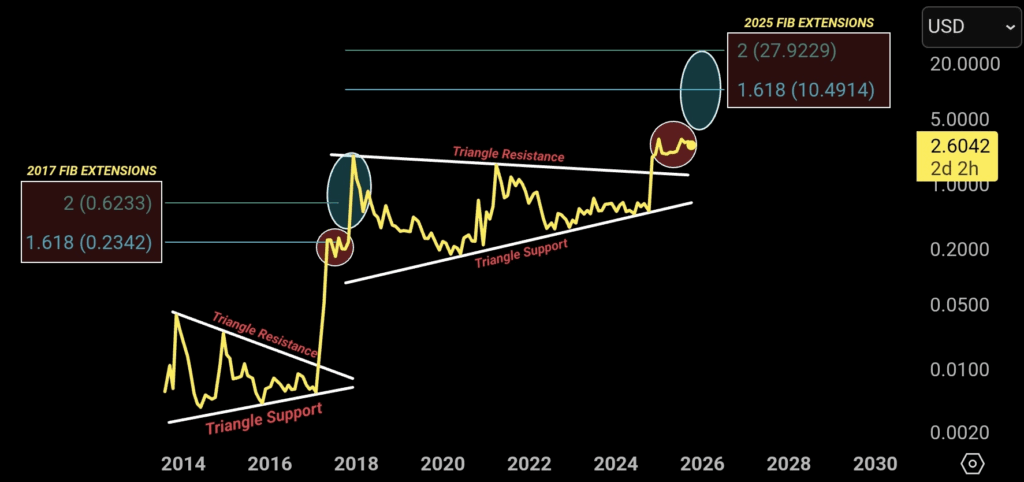
The community has begun to interpret XRP’s silence as the calm before the storm. With price action remaining contained between past cycle highs, many believe the asset is preparing for an explosive surge once the structure completes.
If the breakout above the historical level of resistance at $3.30 is achieved, it might unleash a parabolic motion, hence initiating a new phase of growth, just as it happened in 2017. Until then, the current dormant phase might be viewed as the preparation level, setting the stage for what could be one of XRP’s biggest moves yet.
