Dogecoin (DOGE) Targets $1 Milestone as ETF Buzz and Double-Bottom Pattern Fuel Rally

Meme coin rockets toward psychological barrier as institutional interest grows
Technical Breakout Confirmed
The double-bottom formation that had traders watching for weeks finally triggered—sending DOGE soaring past key resistance levels. Chart patterns don't lie, and this classic reversal setup screams bullish momentum.
ETF Speculation Heats Up
Wall Street's sudden fascination with crypto ETFs now extends to the people's cryptocurrency. Because nothing says 'serious investment' like a asset that started as a joke but might soon trade alongside gold and Bitcoin in regulated funds. The irony isn't lost on anyone who remembers 2021's manic run-up.
Market Psychology at Play
That magical $1 price point represents more than just numbers—it's becoming a self-fulfilling prophecy as retail and institutional money converges. Though let's be honest, watching traditional finance finally embrace what they mocked for years is almost as satisfying as the gains themselves.
The path to dollar-land looks clearer than ever, proving once again that in crypto, the most unlikely heroes often deliver the biggest surprises.

- Dogecoin gains 2.2%, signaling renewed investor interest despite stability over the past week.
- Dogecoin Market Sentiment Strengthens Amid BlackRock’s Plans for a Dogecoin ETF.
- DOGE forms a double-bottom pattern, holding above $0.17 support, hinting at a possible breakout toward $0.35.
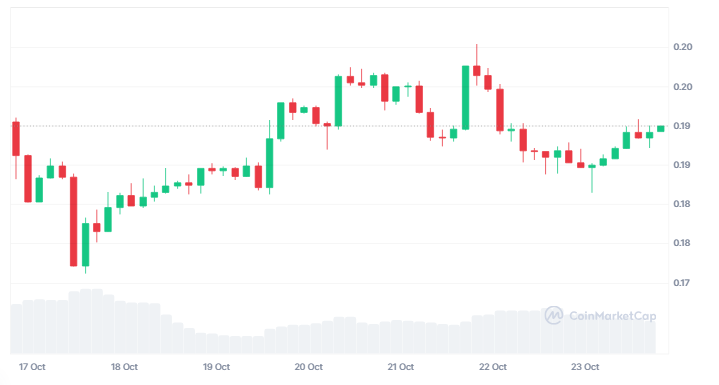
Dogecoin (DOGE) is showing a short-term recovery as buying pressure increases across the market. The token has gained nearly 2.18 in the past 24 hours, suggesting renewed investor interest after a volatile week. However, despite the daily surge, its price has shown stability over the past seven days.
At the time of writing, Doge is trading at $0.1955, with a 24-hour trading volume of $2.13 billion, reflecting a 26.12% decline in trading activity. Its market capitalization stands at $29.62 billion, showing that while bullish momentum is emerging, overall liquidity has slightly weakened.
BlackRock Dogecoin ETF Ignite Bullish Hopes
A prominent crypto analyst, CEO, revealed that BlackRock is preparing to file for a Dogecoin (DOGE) exchange-traded fund (ETF) in the United States. This buzz quickly gained traction within the crypto community, fueling excitement among Dogecoin supporters who view institutional interest as a potential bullish signal.
RUMOR:![]()
![]() BLACKROCK PLANS TO FILE FOR $DOGE (DOGECOIN) ETF pic.twitter.com/kdM8qzK2Y0
BLACKROCK PLANS TO FILE FOR $DOGE (DOGECOIN) ETF pic.twitter.com/kdM8qzK2Y0
However, no official confirmation has been issued by BlackRock or the U.S. Securities and Exchange Commission (SEC). Market observers are treating the claim with caution, noting that ETF filings are subject to strict regulatory review and often take time to materialize.
DOGE Consolidates Before Potential Strong Upside Move
Moreover, a crypto analyst highlighted that dogecoin (DOGE) is maintaining a stable range above its key support near $0.17. The chart shows a long-term base formation following several accumulation phases since early 2024. This structure indicates that DOGE may be preparing for a breakout as buying pressure gradually returns and sellers begin losing strength.
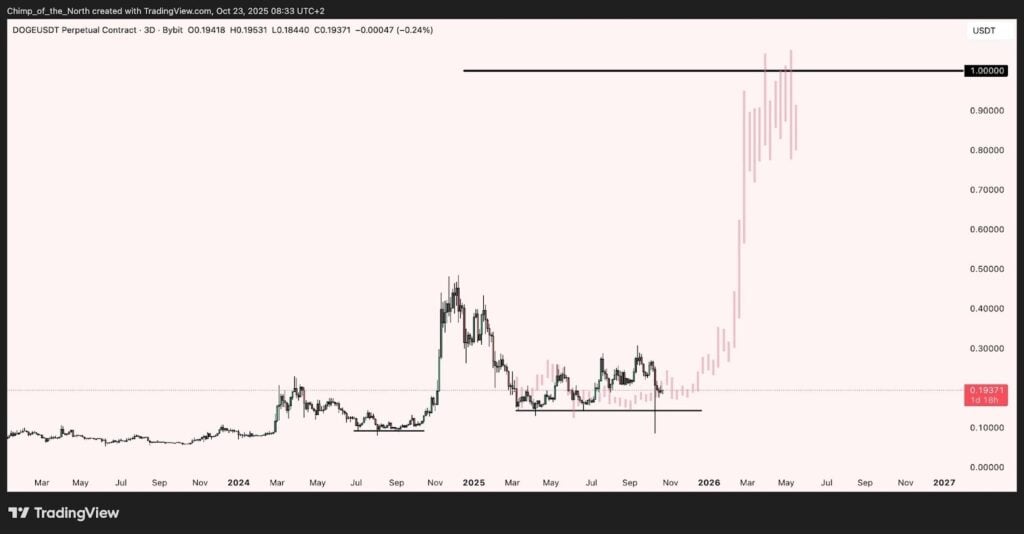
On technical charts, a large double bottom formation has been highlighted around the level of $0.085 to $1. This double bottom pattern has its neckline at or around $0.20 to $0.22, which proves to be a strong level of resistance. A successful breakout at this level WOULD illustrate a strong reversal in price, which might witness a bullish move towards $0.35. But if it falls below $0.17, it may breach this level, returning to support at $0.12 or further to $0.10.
Dogecoin Technical Setup Points to Trend Reversal
The MACD has a weak bearish momentum, as its MACD line (0.00110) remains below its signal line (0.00446) with a slightly negative histogram. This indicates a weakening bearish pressure, which may result in a stabilization phase. A crossover over the signal line may indicate a bullish reversal.
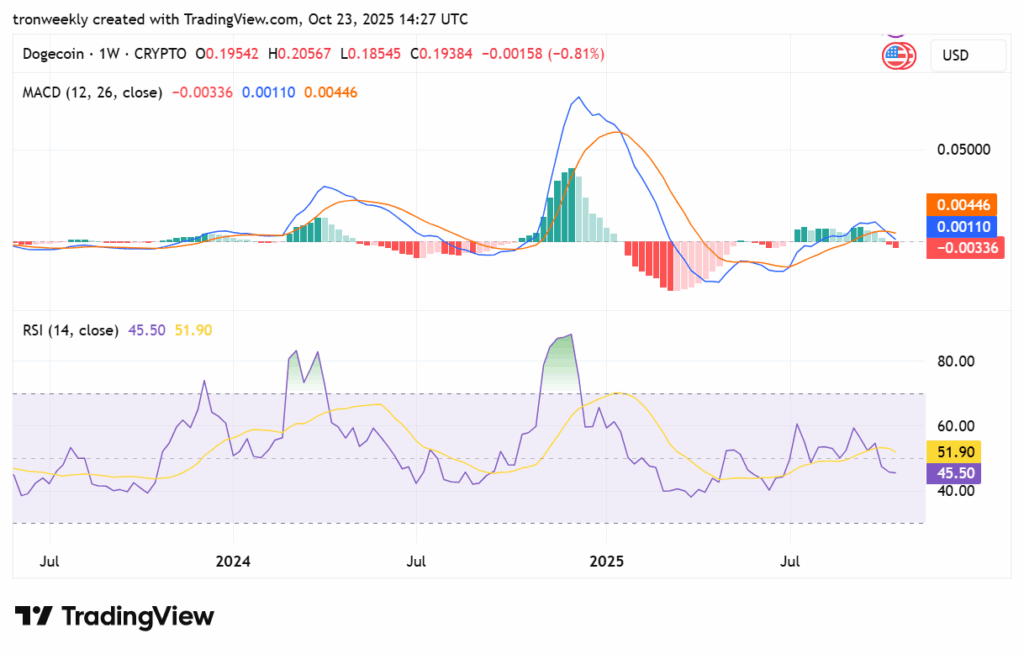
Source: TradingView
The RSI stands at 45.50, which is below 50, indicating mild bearish conditions but no serious trend. This shows a period of consolidation with no momentum. A breakout beyond 55 will indicate renewed strength in buying pressure, whereas a break below 40 may indicate further deterioration.
