Sui (SUI) Technical Analysis: Bullish Triangle Pattern Hints at $8 Breakout Imminent

Sui's chart flashes bullish signals as technical patterns align for potential explosive movement.
Technical Formation Breakdown
The symmetrical triangle pattern tightening on SUI's daily chart suggests consolidation before a decisive move. Volume indicators show decreasing activity within the pattern—classic breakout precursor behavior. Historical data reveals similar formations preceding 40-60% price surges in comparable altcoins.
Key Resistance Levels
Watch the $1.85 resistance zone—a clean break above confirms pattern validation. The measured move target projects toward the $8 region, representing over 300% upside from current levels. Fibonacci extensions from the recent swing low to high reinforce this projection zone.
Market Context & Catalysts
While traditional finance debates yield curves and inflation metrics, SUI's technical setup ignores macroeconomic noise. The pattern's timing coincides with growing developer activity on Sui's blockchain—actual usage versus theoretical valuation debates that plague legacy finance.
Risk Management Essentials
Always pair bullish technicals with disciplined position sizing. The pattern invalidates below $1.40—maintain stop-losses there. Because nothing says 'professional trading' like pretending triangles on charts predict the future better than Wall Street's crystal balls.

- SUI forms a symmetrical triangle pattern, signaling potential for a breakout if resistance levels are breached.
- A confirmed breakout above resistance could propel the token to $7.00–$8.00, marking a potential +180% rally.
- The community confidence highlights long-term trust in Sui’s blockchain performance and ecosystem expansion.
Sui (SUI) is regaining momentum, showing a steady rise in value and attracting increasing attention from investors across the crypto market. Its price has surged by 1.78% over the last 24 hours but is down by 19.6% over the last week.
At the time of writing, sui is trading at $2.78, supported by a market capitalization of $10.09 billion. Moreover, its trading volume decreased 34.13% to $1.47 billion, suggesting that traders are staying on the sidelines until a clear price direction develops.
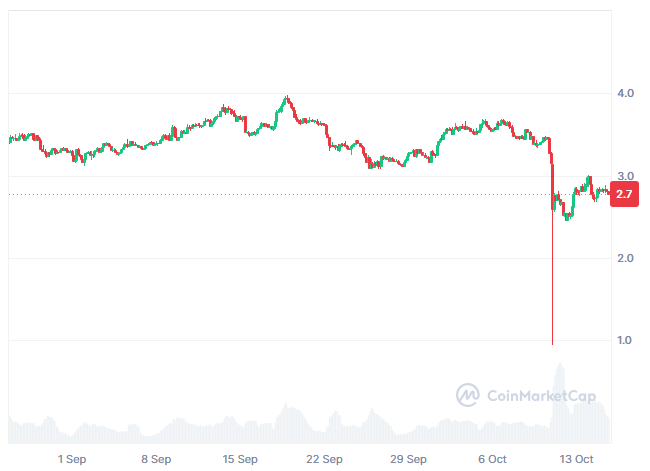
Source: CoinMarketCap
SUI Community Skyrockets with 84% Bullish Votes
The community sentiment reveals that 84% of voters are bullish, showing strong Optimism and confidence in the market’s potential growth. This overwhelming majority believes that prices are likely to increase steadily over time. Such a high level of positivity indicates strong trust and enthusiasm among investors.
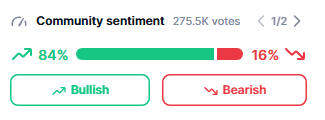
Source: CoinMarketCap
In contrast, 16% of voters are bearish, suggesting that a smaller group anticipates a possible downturn or correction. These participants may be cautious about future market conditions and short-term volatility. However, despite their concerns, the overall sentiment remains clearly and decisively bullish.
Also Read: SUI Rebounds Strongly, Eyes Explosive $5 Breakout Soon
SUI Triangle Pattern Hints at Bullish Breakout to $8
Additionally, crypto analyst Daniel Ramsey provided that SUI has a distinct symmetrical triangle shape that defines a stage of re-accumulation and consolidation. The price action maintains regular higher lows while consecutively testing the higher resistance trendline again and again and demonstrates increased bullish momentum. A confirmed break above this resistance will provide a strong continuation of the uptrend.
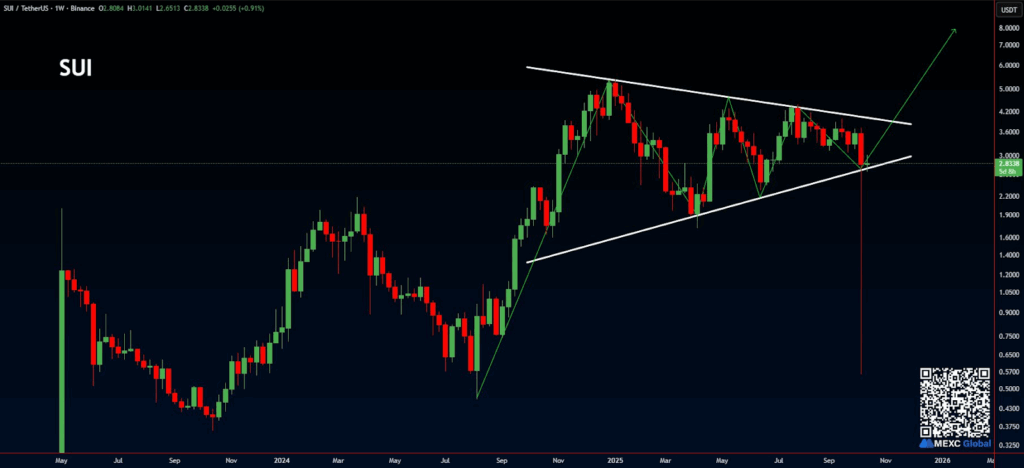
Source: X
If the breakout happens, the experts set a target between $7.00 and $8.00 based on the triangle’s calculated move. This breach may draw higher trading volume and aggressive bullish momentum, supporting the higher trajectory. A downward break below the uptrend support line will negate the chart pattern and may initiate a retardation phase prior to a recovery move.
SUI Technicals Indicates Cautious Momentum Ahead
The chart indicates a sudden fall below the lower Bollinger Band in early October, hinting at strong selling pressure. Now the price has stabilized above $2.77 but remains below the mid-band resistance of $3.23. This indicates that bearish momentum is dominant, but short-term stabilization is emerging.
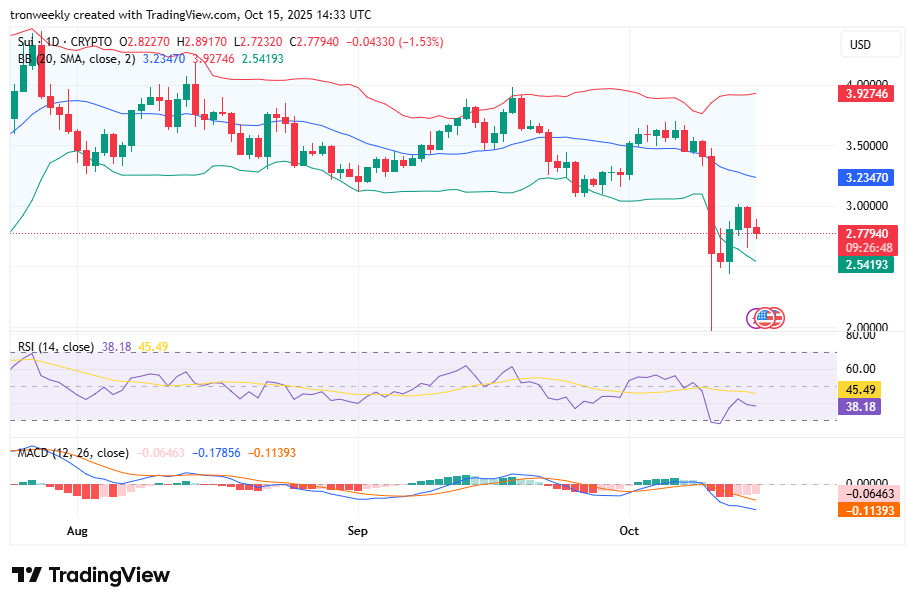
Source: TradingView
However, the RSI at 38.18 states poor momentum, recovering by a bit from the oversold levels. MACD lines are still bearish, with the MACD line positioned below the signal line, validating bearish pressure. But the decreasing histogram bars are a sign of a potential slowing in the downtrend.
Also Read: sui price Outlook: Key Support at $2.60 Could Ignite Rally Toward $8
