Cardano’s $3.10 Quest: Can ADA Shatter Its All-Time High Before 2026?

Cardano's ticking clock starts now—$3.10 or bust.
The Countdown Begins
ADA faces its ultimate test: reclaiming that elusive $3.10 peak before 2026's calendar flips. No room for nostalgia—just pure price action.
Market Forces Collide
Institutional money flows while retail traders watch from the sidelines. Volatility isn't just likely—it's guaranteed. The charts don't care about sentiment, only momentum.
Technical Breakout or Breakdown?
Every resistance level becomes a battleground. Support zones either hold firm or crumble under pressure. There's no middle ground in crypto—only binary outcomes.
The Final Verdict
Wall Street's traditional metrics look increasingly irrelevant against Cardano's decentralized architecture. Whether ADA hits $3.10 becomes less about fundamentals and more about market psychology—because in crypto, sometimes the most sophisticated analysis boils down to 'number go up' theology.

- Moving Average and MACD indicators signal a bearish trend for ADA.
- Cardano shows strong late-2025 gains, but reclaiming its $3.10 ATH before 2026 remains unlikely.
Leading altcoin Cardano (ADA) holds a market capitalization of around $27.72 billion, maintaining its position among the top cryptocurrencies. With a 24-hour trading volume of nearly $1.51 billion, ADA’s price movements remain in focus as traders monitor technical signals and ecosystem developments amid ongoing market volatility.
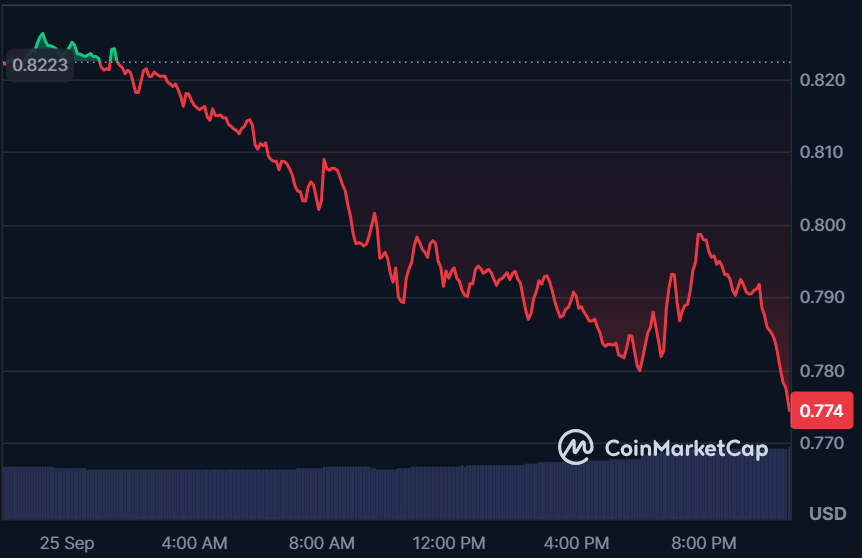
At press time, the altcoin is trading at $0.7740, having decreased by 6.12% over the past 24 hours. The price is moving in a bearish trend and is currently testing a resistance level NEAR $0.814. If it breaks above this, the next target could be $0.850. On the downside, the support level is around $0.806. If the altcoin falls below this, we might see a drop towards $0.800.
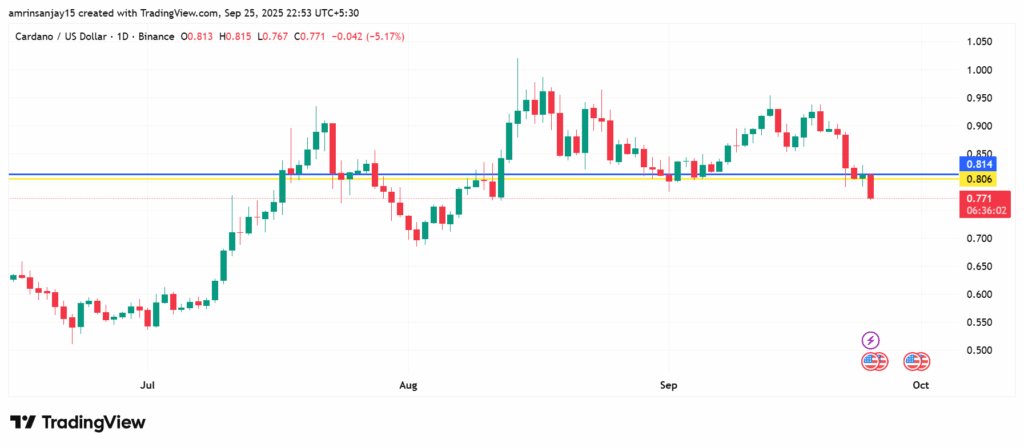
The blue line indicates the resistance level at $0.814, while the yellow line represents the support level at $0.806.
Analyzing Cardano’s (ADA) Moving Average and MACD
According to the Moving Average chart, the cryptocurrency is currently experiencing a bearish trend with the moving average indicator above the candles at $0.861. Also, the Moving Average Convergence Divergence (MACD) shows a bearish crossover, suggesting that the price is likely to keep decreasing for a while.
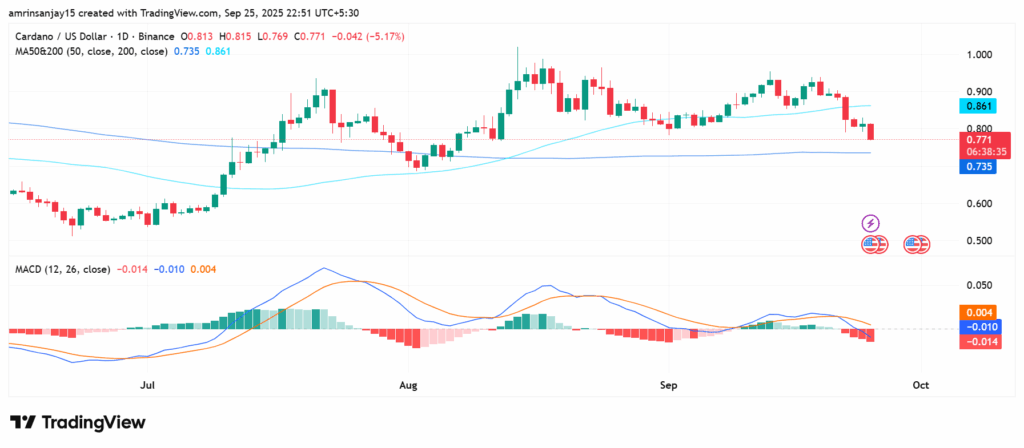
The signal line above the MACD line indicates a bearish crossover. The blue line represents the MACD line, while the orange line indicates the signal line.
Coincodex’s Prediction for Cardano (ADA)
According to Coincodex’s current price prediction for the altcoin, the price is predicted to rise by 30.85% and reach $ 1.03 by October 25, 2025. Based on the ADA forecast, it’s now a bad time to buy the altcoin.
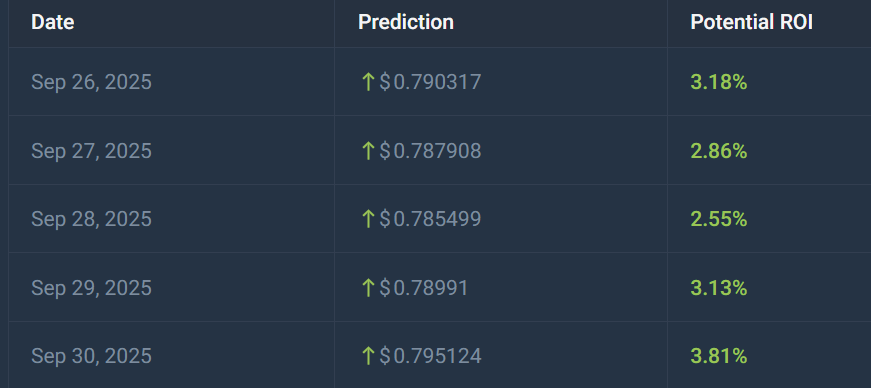
Over the next five days, cardano will reach the highest price of $ 0.795124 on September 30, 2025, which would represent 3.81% growth compared to the current price. This follows a -17.21% price change over the last 7 days.
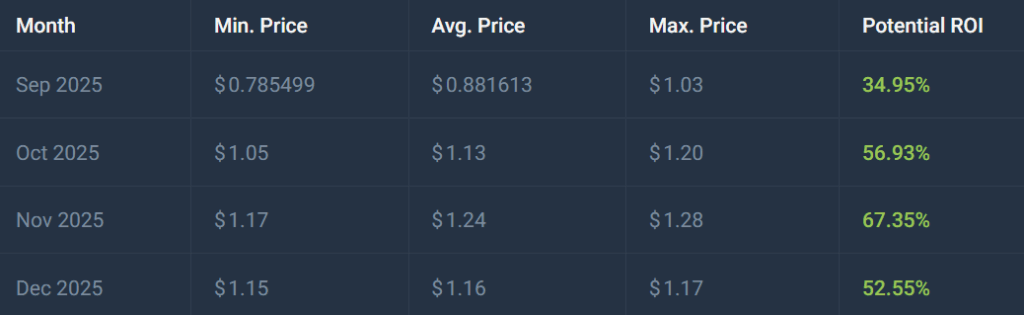
The Coincodex data highlight a strong growth momentum, with ADA likely to cross and sustain the $1+ zone throughout Q4 2025. However, reclaiming the $3.10 ATH by 2026 WOULD require nearly a 3x price surge beyond these forecasts.
While the trend shows ADA gaining strength, ADA may struggle to reach its ATH before 2026.
