SUI at Critical Junction: Bulls Battle for $3.47 Breakout or Face Deeper Correction

SUI traders hold their breath as the digital asset teeters at a make-or-break momentum threshold.
Technical Tug-of-War
The $3.47 resistance level emerges as the line in the sand separating bullish momentum from potential retracement. Market watchers see mounting pressure from both directions—accumulation patterns suggest institutional interest while derivative data flashes warning signs.
Volume Tells the Tale
Spot trading activity surges near the key psychological barrier, indicating either preparation for breakout momentum or distribution before a drop. Whales move positions quietly while retail traders amplify volatility with leveraged bets.
Market Psychology at Play
Traders wrestle with conflicting signals: strong fundamental developments against broader market headwinds. The crypto crowd splits between those seeing $3.47 as a springboard to new highs and others viewing it as the ceiling before a 20% slide.
Regulatory shadows loom over the entire sector—because nothing says 'decentralized future' like waiting for bureaucratic approval. The next 48 hours will determine whether SUI joins the September rally or becomes another 'almost' story in crypto's volatile history.

- SUI drops 3.11% in 24 hours to $3.25, but trading volume rises by 16.59% to $1.21 billion.
- Analysts predict SUI could reach $3.56-$3.60 if it breaks above the $3.47 mark, waiting for clear signals.
- RSI at 40.05 shows SUI is oversold, with MACD indicating bearish momentum as selling pressure continues.
SUI is currently trading at $3.25, and its price has dropped by 3.11% over the last 24 hours. Even with this fall in price, the trading volume has represented an upward trend, increasing by 16.59 percent and currently standing at $1.21 billion.
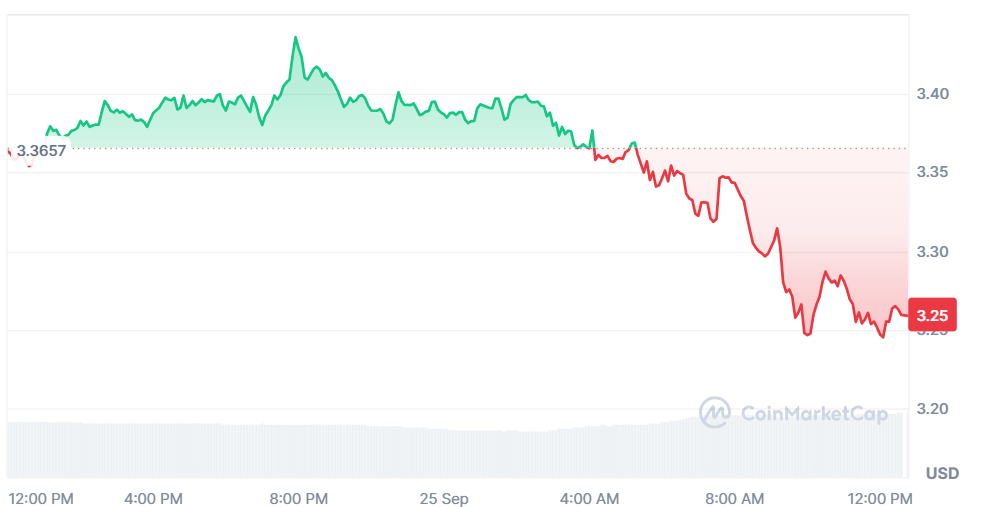
Source: CoinMarketCap
Over the last week, the price of the sui has decreased by 14.33%. This decreasing trend indicates that there is a bearish trend in the short term, even when there is increasing volume trading, which is a sign of enthusiasm by the investor.
Key Breakout Could Signal Bullish Move for SUI
Crypto analyst More crypto Online highlighted that should the SUI reach above the $3.47 mark, it may eventually touch the $3.56-$3.60 level. Analysts are currently waiting for a definitive five-wave upward movement to confirm the trend.
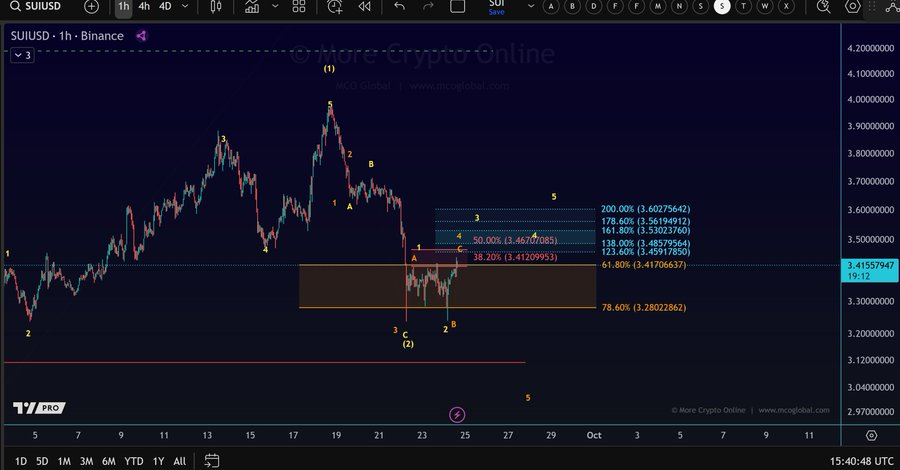
Source: X
Additionally, another analyst, Man of Bitcoin, has mentioned that the SUI roadmap is valid as long as the price remains above the support level of the price at $3.108. A fall below this WOULD also point to the occurrence of an alternative-wave-2 pattern and the continued drop of the price.
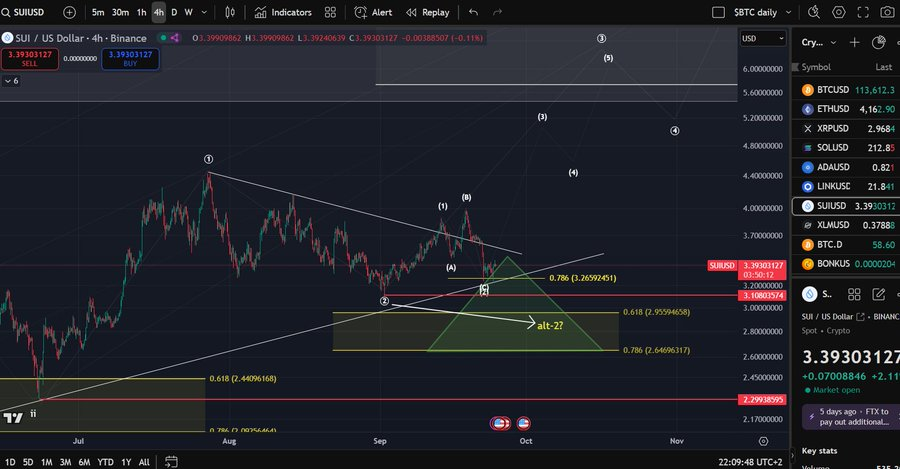
Source: X
SUI Faces Downward Pressure as RSI and MACD Remain Bearish
The Relative Strength Index (RSI) is 40.05, which is less than the neutral 50-mark. This indicates that SUI has entered an oversold state and does not have purchasing force. In case the price is still falling, it might be possible that the RSI might even fall further, and this may be an indicator of a rebound in case the buying pressure increases.
The Moving Average Convergence Divergence (MACD) is displaying negative signals. The MACD line stands below the signal line, at -0.0376, which affirms the downward trend. The histogram also appears in red, which shows there is selling pressure. This would indicate that its bearish momentum is bound to continue until a market change takes place.
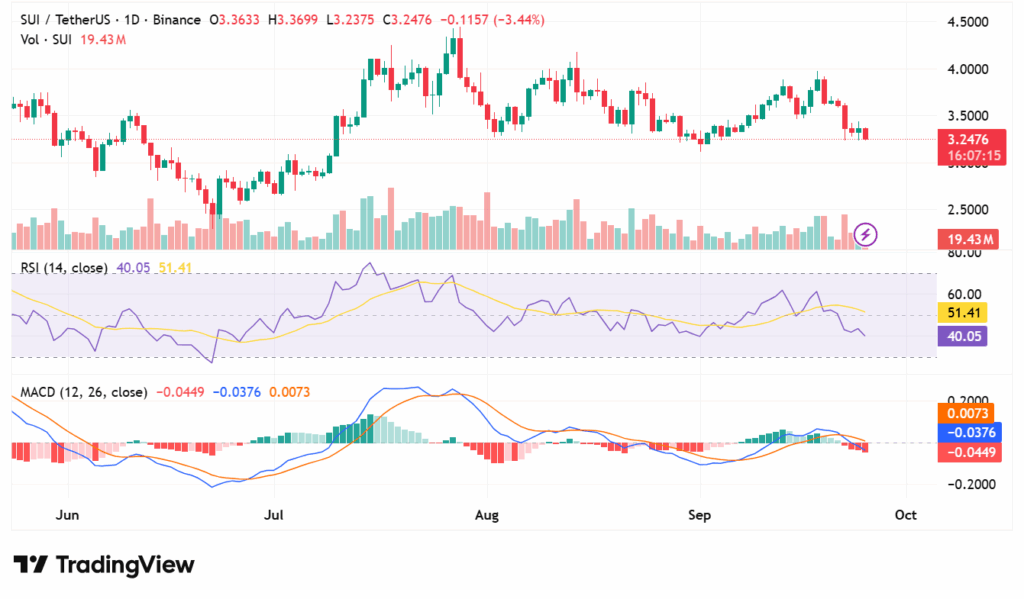
Source: TradingView
Open Interest Drops for SUI, Indicating Lower Market Activity
CoinGlass data shows that trading volume has gone down by 19.88% to $6.17 billion. Open interest is also down to 1.45%, now standing at $1.77 billion. The SUI OI-Weighted Funding Rate is 0.0070%, which indicates low short interest. Although the open interest and volume are decreasing, the funding rate implies that the market does not have an extreme bearish position.
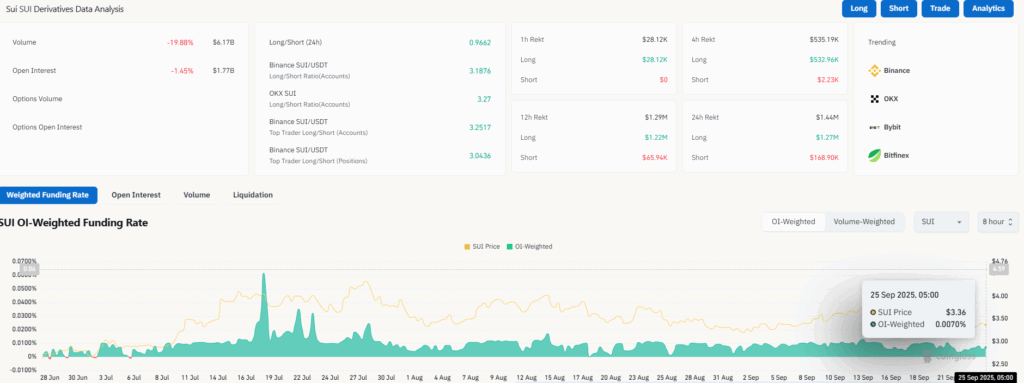
Source: CoinGlass
Cryptocurrency is experiencing a volatile market. Although the price does not actually increase yet, a higher volume of trade is a good sign of great interest among investors. The technical indicators suggest that further declines may occur, but support levels remain crucial. If the token can hold above the key levels, a recovery may be on the horizon soon.
