Tron (TRX) Seasonal Surge: Is December Primed for Another Major Rally?

TRX bulls eye December's historical patterns as potential launchpad.
Seasonal Strength Signals
Tron's blockchain activity typically spikes during holiday seasons—decentralized applications see increased usage while traditional finance takes its annual nap. The network's throughput capabilities position it perfectly for end-of-year transaction surges.
Technical Positioning
TRX maintains critical support levels despite recent market volatility. Trading volumes suggest accumulating interest from institutional players seeking exposure to established Layer 1 protocols. The token's correlation with broader crypto markets could work in its favor if Santa delivers a market-wide rally.
Market Dynamics
While some traders chase shiny new tokens, Tron's established ecosystem offers something rare in crypto: actual utility. The network continues processing transactions at a fraction of Ethereum's costs—because nothing says holiday cheer like avoiding gas fee nightmares.
December's verdict? History suggests favorable winds, but in crypto, past performance is about as reliable as a banker's promise. The real question isn't whether Tron will rally—it's whether traders will wake up before the move happens.

- Moving Average and MACD indicators signal a bearish trend for TRX
- December remains strong with a 12.19% potential ROI, signaling steady gains.
Tron (TRX), the native token of the TRON blockchain, currently holds a market cap of around $31.89 billion, securing its place among the top digital assets. With a 24-hour trading volume of nearly $795.34 million, the altcoin’s price movements continue to attract attention as traders look for signals on its next direction amid ongoing market volatility.
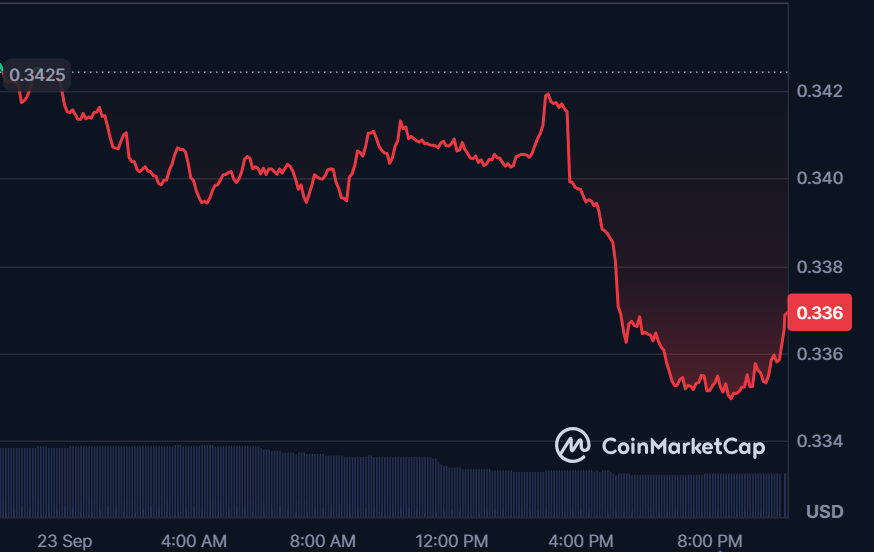
At press time, the altcoin is trading at $0.3369, having decreased by 1.54% over the past 24 hours. The price is moving in a bearish trend and is currently testing a resistance level NEAR $0.3475. If it breaks above this, the next target could be $0.3600. On the downside, the support level is around $0.3405. If the altcoin falls below this level, we might see a drop towards $0.3200.
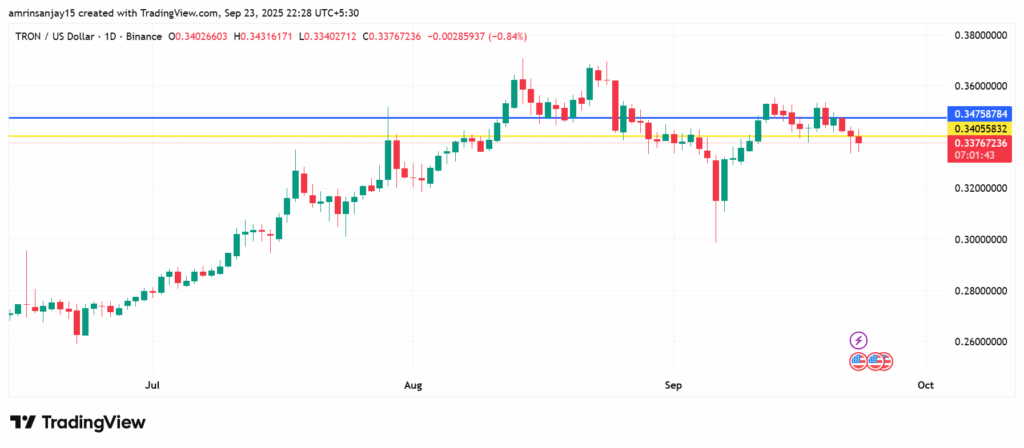
The blue line indicates the resistance level at $0.3475, while the yellow line represents the support level at $0.3405.
Analyzing Tron’s Moving Average and MACD
According to the Moving Average chart, the cryptocurrency is currently experiencing a bearish trend with the moving average indicator above the candles at $0.3446. At the same time, the Moving Average Convergence Divergence (MACD) indicates a bearish crossover, suggesting that the price may continue to decrease.

The signal line above the MACD line indicates a bearish crossover. The blue line represents the MACD line, while the orange line indicates the signal line.
After November’s Peak, TRX Eyes Steady Growth Through December
According to Coincodex’s current price prediction for the altcoin, the price is expected to rise by 7.73% and reach$ 0.366996 by October 23, 2025. Based on the TRX forecast, it’s now a bad time to buy the altcoin.
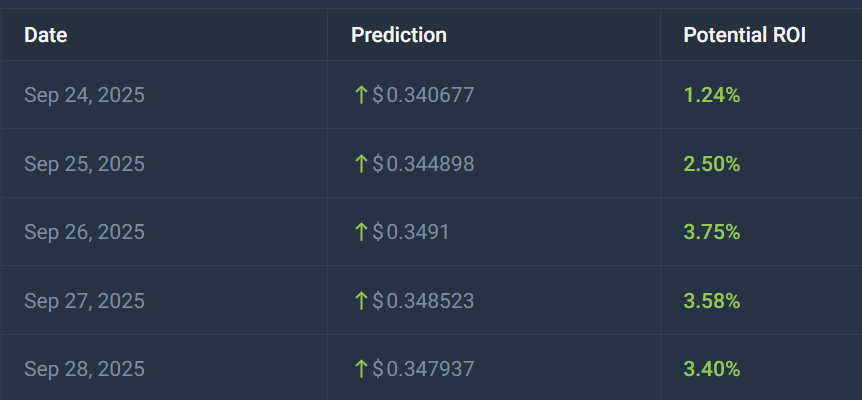
According to Coincodex data, the altcoin is expected to reach its highest price of $0.3491 on September 26, 2025, representing a 3.75% growth compared to the current price. This follows a -1.74% price change over the last 7 days.

Based on this Coincodex data, October and November mark the peak period, with November offering the highest potential ROI at 13.23%, suggesting the market may favor TRX in these months.
December shows a slight dip in ROI (12.19%) compared to November, but remains strong. This indicates that while December may not surpass November’s peak, TRX could still maintain bullish momentum, providing opportunities for end-of-year gains.
Conclusion:
Tron’s seasonal trend shows November as the peak month with a potential ROI of 13.23%, while December remains strong at 12.19%, signaling continued bullish momentum. Although it may not spark an explosive rally, TRX is positioned for steady year-end gains, making it a prime window for accumulation and strategic trading.
