Sui (SUI) Price Prediction: Cup and Handle Breakout Targets $4.50+ in Explosive Move

Sui's chart flashes one of technical analysis' most reliable bullish patterns—and it's setting up for a major breakout.
The Technical Setup
That classic cup and handle formation completes as SUI consolidates above key support levels. The pattern typically signals accumulation before a significant upward move.
Breaking Through Resistance
Traders watch the $4.50 level like hawks—a clean break above this psychological barrier could trigger cascading buy orders. Volume patterns suggest institutional interest building beneath the surface.
Market Context Matters
While technicals look promising, remember that chart patterns work until they don't—just ask anyone who traded the 'sure thing' breakout last quarter. But with Sui's fundamentals strengthening and developer activity hitting new highs, this setup deserves attention.
The cup runneth over—if this pattern holds, we're looking at a potential 30%+ move in the coming weeks. Time to see if the handle completes the pour or if we get another classic crypto fakeout.

- Sui (SUI) is consolidating in a cup and handle pattern, a classic bullish signal often preceding major breakouts.
- Technical indicators show mixed signals; RSI remains neutral at 50.33, while MACD reveals a bearish crossover.
- Analysts suggest a breakout above $4.20 could push SUI toward $4.50 and beyond, marking a new bullish phase.
Sui (SUI) is picking up steam with the emerging confidence in the crypto sphere. The token is currently consolidating in the cup and handle pattern, which often paves the way to a strong reversal. The sui price over the last 24 hours is up by 0.53%, but over the last week it is slightly down by 3.85%.
At the time of writing, sui is trading at $3.38 with a 24-hour trading volume of $1.22 billion, down by 10.38% over the last 24 hours. The token has a market capitalization of $12.08 billion, which is slightly up by 0.48%.
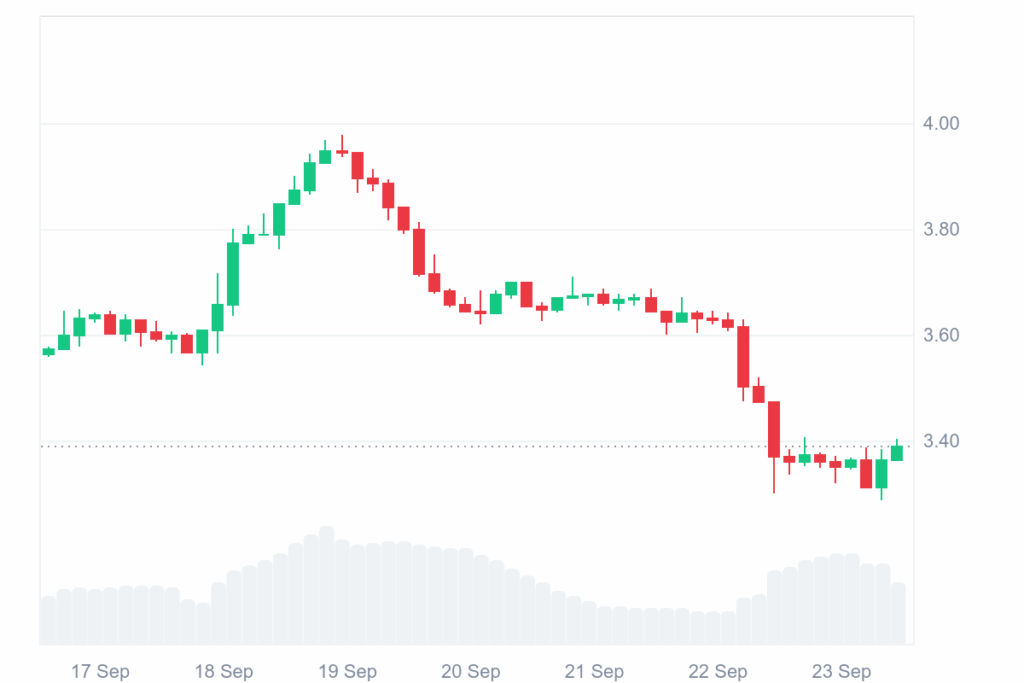
Source: CoinMarketCap
The general trend in the crypto market is turning from bearish to bullish after the highly volatile condition. Now, the BTC is moving upward, which has urged the overall market, including altcoins like SUI.
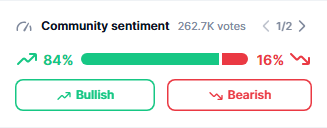
Sui (SUI) Gains Confidence With Bullish Sentiment
According to the data from CMC, the SUI sentiment of the community reveals that 84% of voters are bullish, which indicates immense Optimism for the market or the asset. This majority indicates belief in a jump up. As this is a very high percentage, the overall sentiment is highly positive.
Source: CMC
On the other hand, 16% of voters are bearish, meaning cautious or expecting a decline. As a minority view, it indicates some concern among voters. This comparison makes one thing amply clear: the optimism dominates, but a segment does entertain doubts.
Also Read: SUI price Eyes Breakout Toward $4 After Falling Wedge Pattern Confirmation
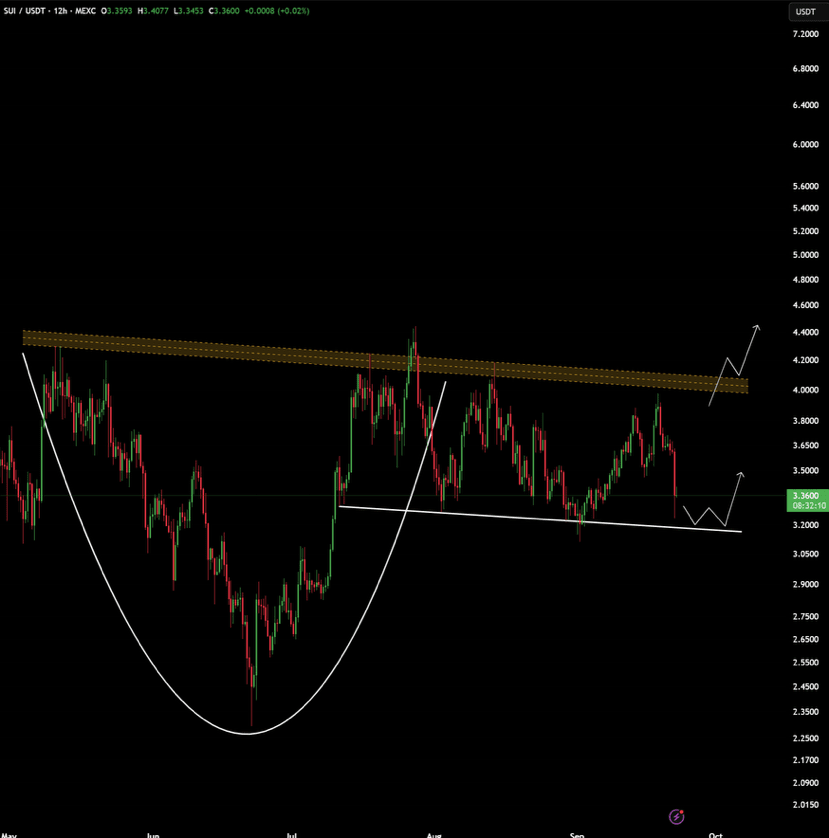
SUI Cup and Handle Eyes Breakout Above $4.50
The crypto analyst, MoonBitz, revealed that Sui (SUI) has been trading for months within a well-established band, holding good support at the level of $3.20 while unable to break through the $4.00–$4.20 barrier level. Technical analysts point out this months-long lateral movement seems to be developing into a typical cup-and-handle formation, a bullish chart form historically preceding big upswings.
Source: X
A definitive breakout past the $4.20 level of resistance could trigger new upward movement, with SUI potentially heading up to $4.50 and beyond in the short term. Ongoing higher lows, strong accumulation patterns, and increasing sentiment all support the bullish configuration, keeping traders and investors eager to await SUI’s next definitive move.
SUI Technicals Provide a Bearish Outlook
According to the technical analysis, the current price sits slightly below the mid-Bollinger band at $3.46, which reflects moderate but notable bearish pressure against the market. Significant resistance aligns around the upper band at $4.30, with regular support at $2.62 around the lower band.
Source: TradingView
The current value of the RSI is 50.33, which shows balanced and neutral movement without significant strength by the bears or the bulls. However, the MACD indicates a bearish crossover since the line of the MACD persists below the signal line, which implies vulnerability and possible further short-term losses.
Also Read: Sui Price Pullback Tests $3.50 Support, Targeting Rebound Toward $3.70
