XRP Final Surge: Analyst Applies Fibonacci and Regression Models to Forecast $27 Target This Cycle

XRP's moment of truth approaches as technical analysis points toward a historic breakout pattern.
Mathematical Precision Meets Market Momentum
Combining Fibonacci retracement levels with advanced regression modeling, one analyst charts XRP's potential trajectory toward the $27 mark—a figure that would represent one of crypto's most dramatic rallies. The models suggest we're witnessing the final consolidation phase before the anticipated upward surge.
Timing the Breakout
While traditional analysts debate P/E ratios, crypto traders watch Fibonacci sequences and regression channels. The current pattern mirrors previous cycle formations that preceded major asset appreciation—except this time with more sophisticated modeling and considerably more institutional money waiting on the sidelines.
Market Cycles Don't Lie—But They Do Repeat
Historical data combined with technical indicators creates a compelling narrative for XRP's potential performance. The $27 target isn't just random speculation; it's a calculated projection based on established mathematical principles that have predicted market movements since well before most Wall Street firms understood blockchain technology.
Of course, in crypto, even the most sophisticated models still compete with meme culture and Elon Musk's Twitter feed—because nothing says 'sound investment strategy' like a dog-themed coin and a billionaire's off-hand comment.
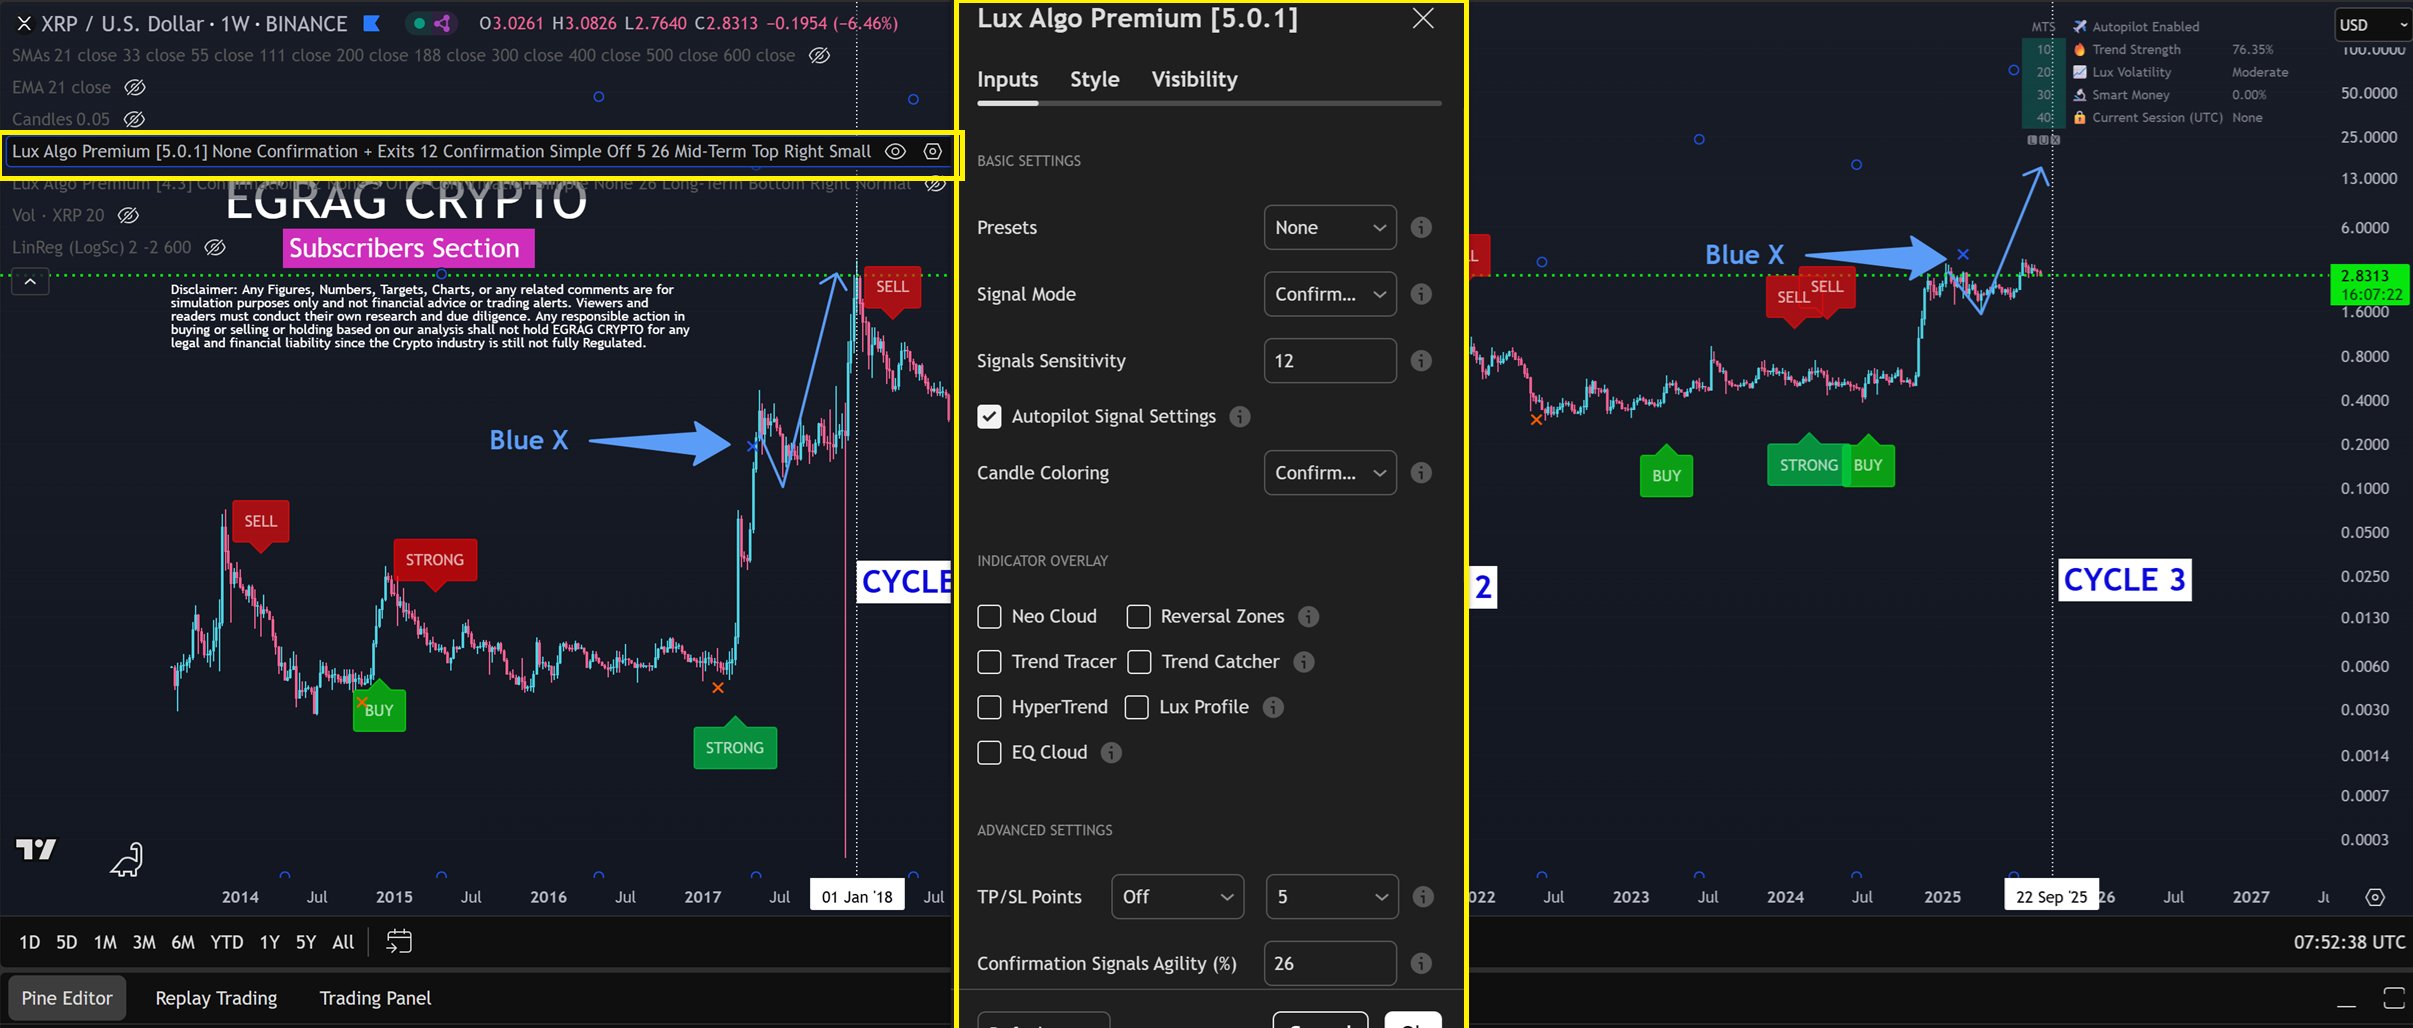 XRP Lux Algo Premium Indicator
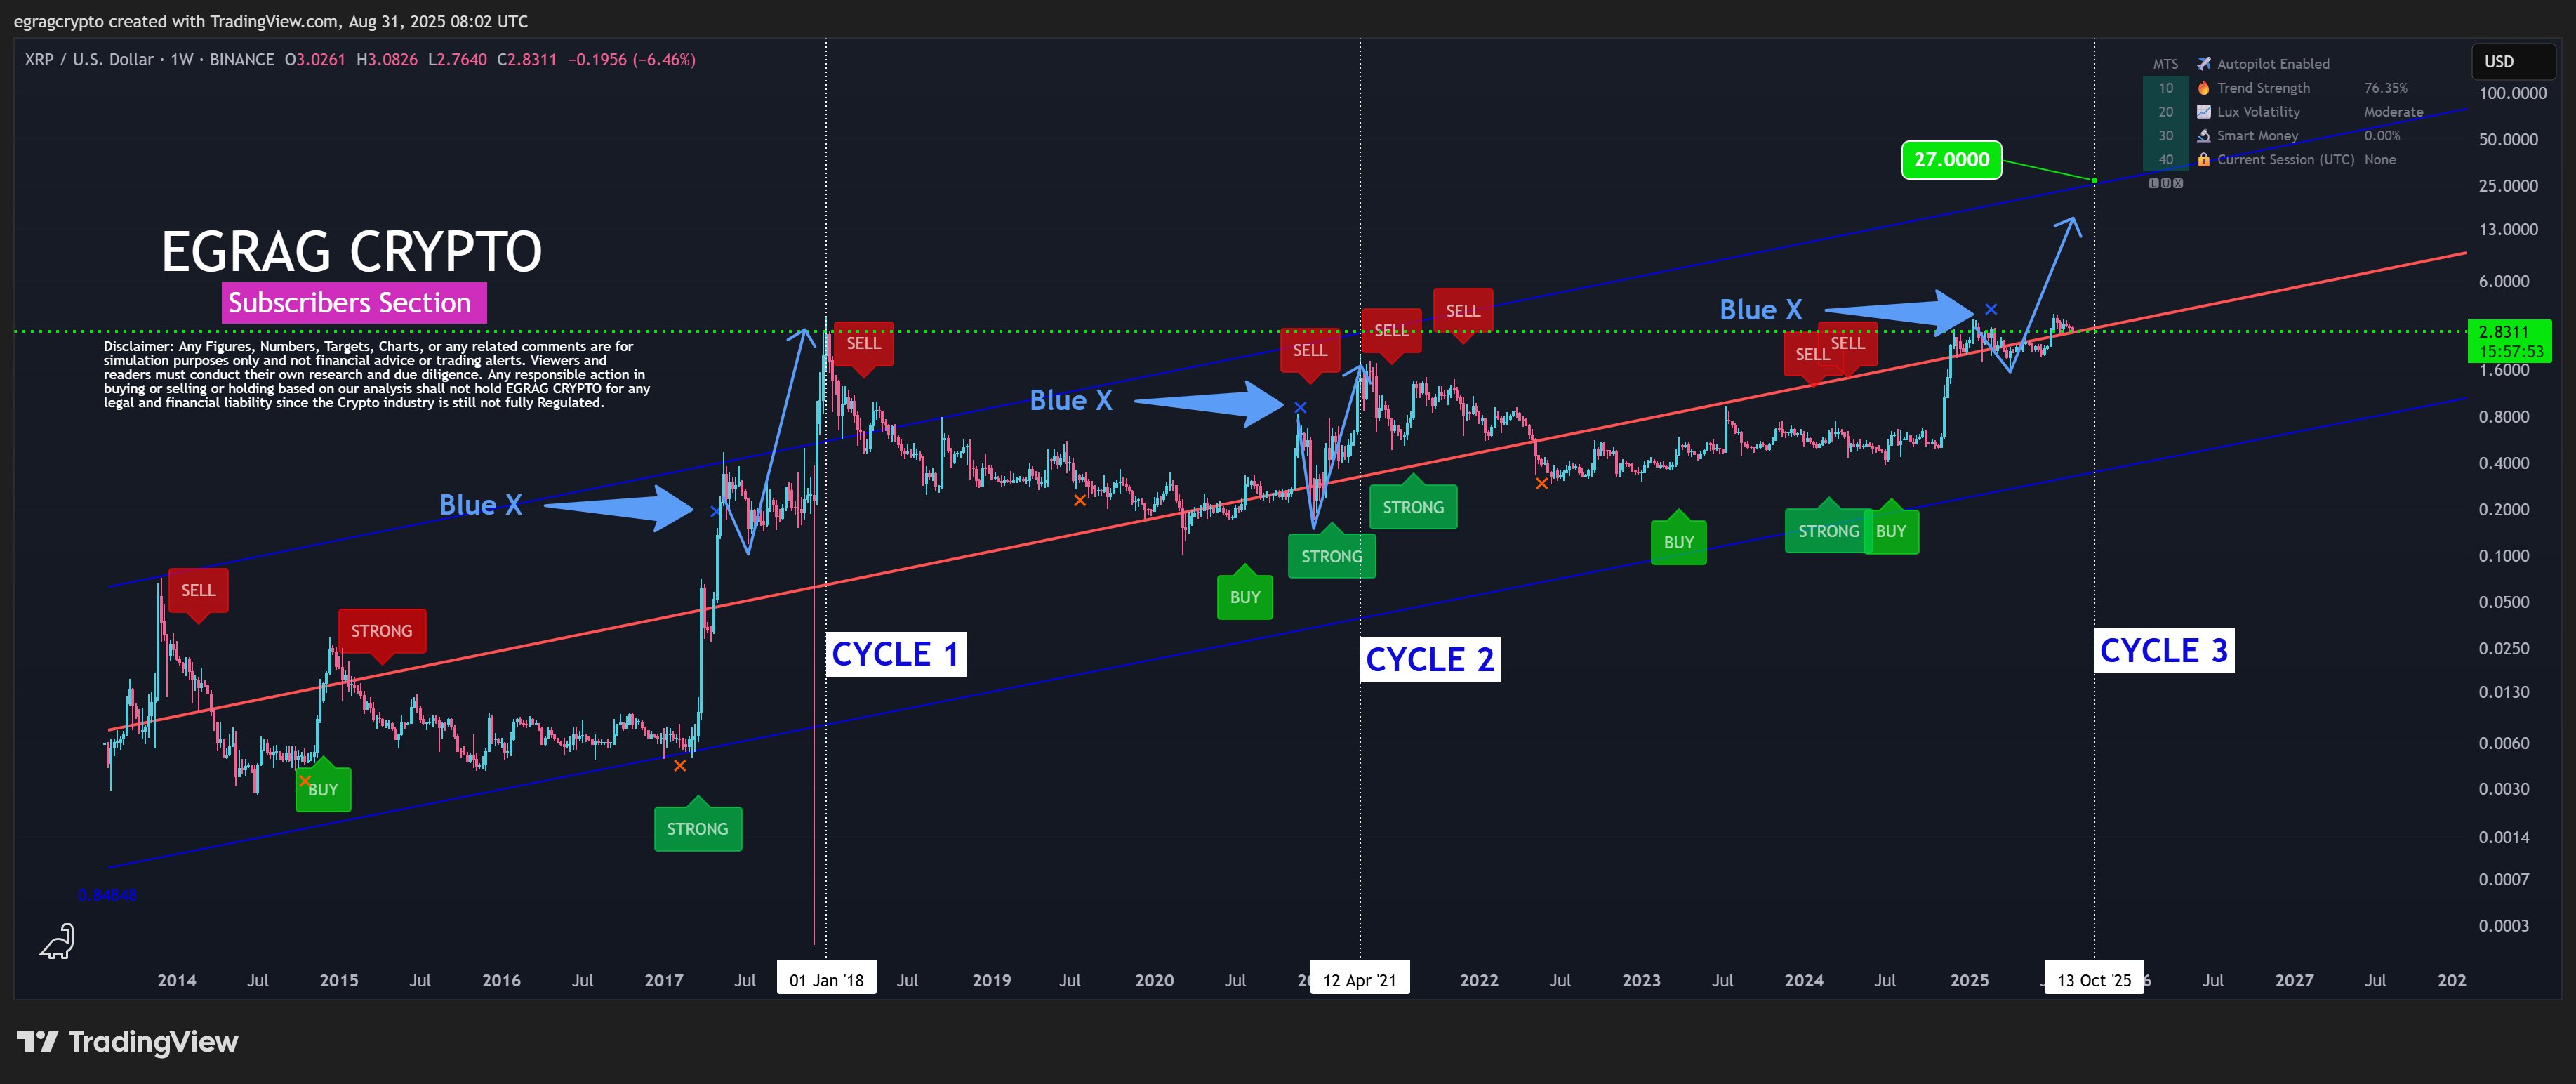
However, he explained that in previous cycles, the Blue X sometimes misled traders into thinking a cycle top had arrived when it had not.
Specifically, what typically happens is that the Blue X prints when XRP hits a top, followed by a corrective phase to form a local bottom. However, after this correction, a strong upward push toward the true cycle peak emerges, which historically forms without any Blue X appearing at the top.
The chart covers XRP's entire price history from 2013 to 2025, separated into three main cycles. Cycle 1 ended around January 2018, while Cycle 2 concluded in April 2021, both topping out NEAR the upper boundary of a long-term linear regression channel.
For context, in the 2017/2018 cycle, XRP printed the Blue X when it hit $0.3988 in May 2017. However, after the correction, the true cycle top emerged at $3.3 in January 2018. Also, in the 2020/2021 cycle, XRP saw the Blue X when it soared to $0.79 in November 2020. However, after the pullback, it rose to the true cycle top of $1.96 in April 2021.
XRP Lux Algo Premium Indicator
However, he explained that in previous cycles, the Blue X sometimes misled traders into thinking a cycle top had arrived when it had not.
Specifically, what typically happens is that the Blue X prints when XRP hits a top, followed by a corrective phase to form a local bottom. However, after this correction, a strong upward push toward the true cycle peak emerges, which historically forms without any Blue X appearing at the top.
The chart covers XRP's entire price history from 2013 to 2025, separated into three main cycles. Cycle 1 ended around January 2018, while Cycle 2 concluded in April 2021, both topping out NEAR the upper boundary of a long-term linear regression channel.
For context, in the 2017/2018 cycle, XRP printed the Blue X when it hit $0.3988 in May 2017. However, after the correction, the true cycle top emerged at $3.3 in January 2018. Also, in the 2020/2021 cycle, XRP saw the Blue X when it soared to $0.79 in November 2020. However, after the pullback, it rose to the true cycle top of $1.96 in April 2021.