BTCC
/
BTCC Square
/
Thecryptobasic
/
Shiba Inu Primed for 1,000% Explosion to $0.000150 as SHIB Coils in Tight Weekly Triangle
Shiba Inu Primed for 1,000% Explosion to $0.000150 as SHIB Coils in Tight Weekly Triangle

25
1
Shiba Inu isn’t just barking—it’s growling. The meme coin’s price action has tightened into a weekly triangle pattern, and if history repeats, a breakout could send SHIB soaring past $0.000150. That’s a 1,000% moonshot from current levels.
The Technical Squeeze
Charts don’t lie—unless you’re a Wall Street analyst. SHIB’s consolidation mirrors past setups that preceded parabolic runs. The tighter the coil, the harder the launch.
Meme Momentum vs. Macro Reality
While fundamentals remain… debatable, crypto’s favorite underdog has defied skeptics before. Just don’t mention the 99% of shitcoins that vanish before their first birthday.
Buckle up. This dog might finally hunt.
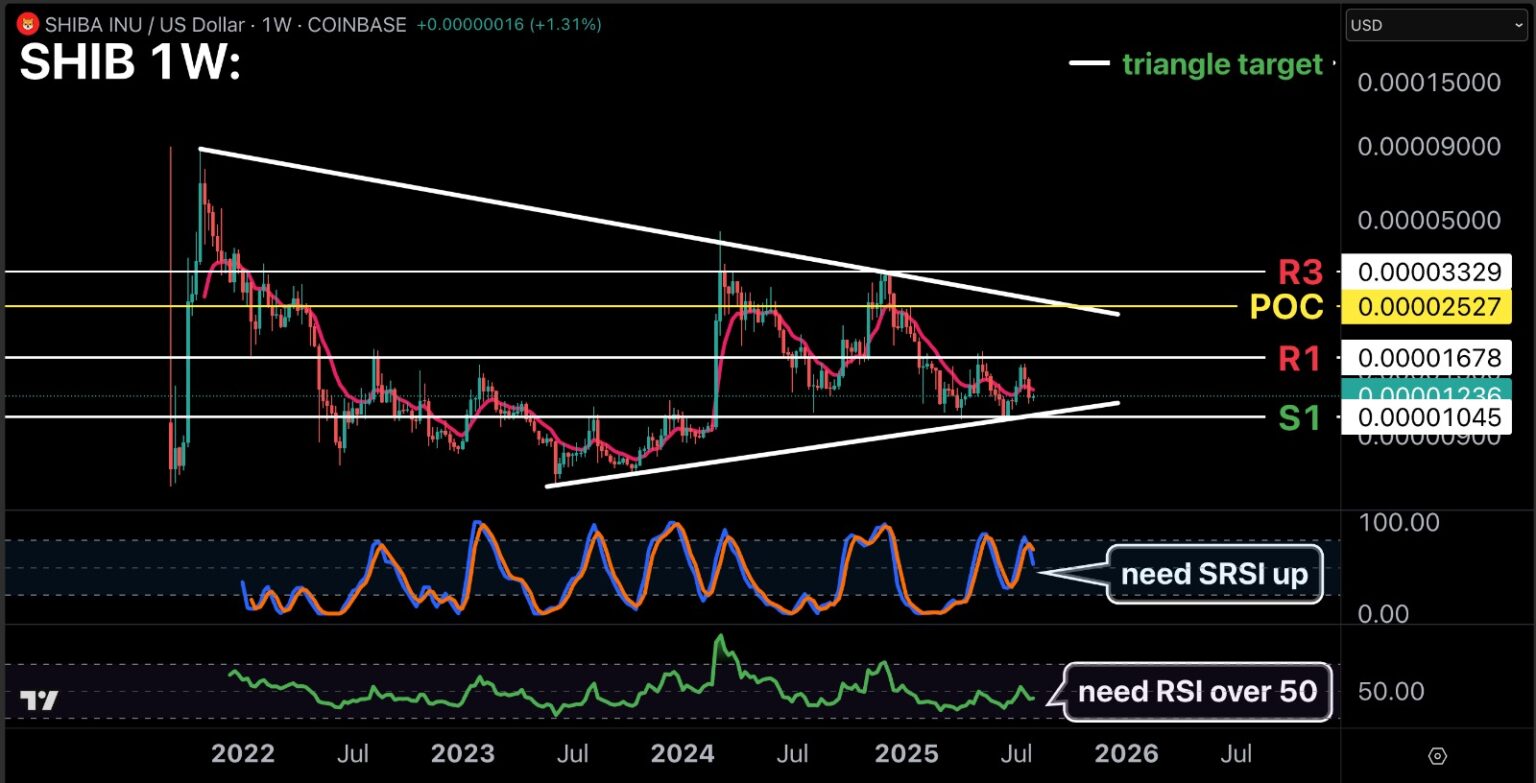 Notably, Shiba Inu's first resistance zone stands at 0.00001678, and a point of control (POC) level is highlighted at 0.00002527. An additional resistance appears at 0.00003329. For context, Shiba Inu has not traded above 0.00003 since December 5, 2024.
A breakout above the first resistance level and POC could lead toward the annotated triangle target of 0.00015, representing a new all-time high. From the current price, that move would represent a gain of approximately 1,053%. For context, Shiba Inu's all-time high was 0.00008616, recorded in October 2021.
RSI Points to Shiba Inu's Bullish and Bearish Scenarios
Interestingly, the chart also features the stochastic relative strength index (SRSI) and the standard RSI to assess momentum. Currently, both indicators are trading below thresholds, signaling that buying strength remains limited.
A bullish scenario could play out if SHIB secures a weekly close above the triangle’s upper boundary at the first resistance, ideally accompanied by the RSI crossing 50 and the SRSI trending higher. This would validate the measured move projection toward $0.000150.
In contrast, a bearish outcome would be triggered if the price closes below the ascending trendline or drops under S1, potentially opening the way for deeper declines toward lower support levels.
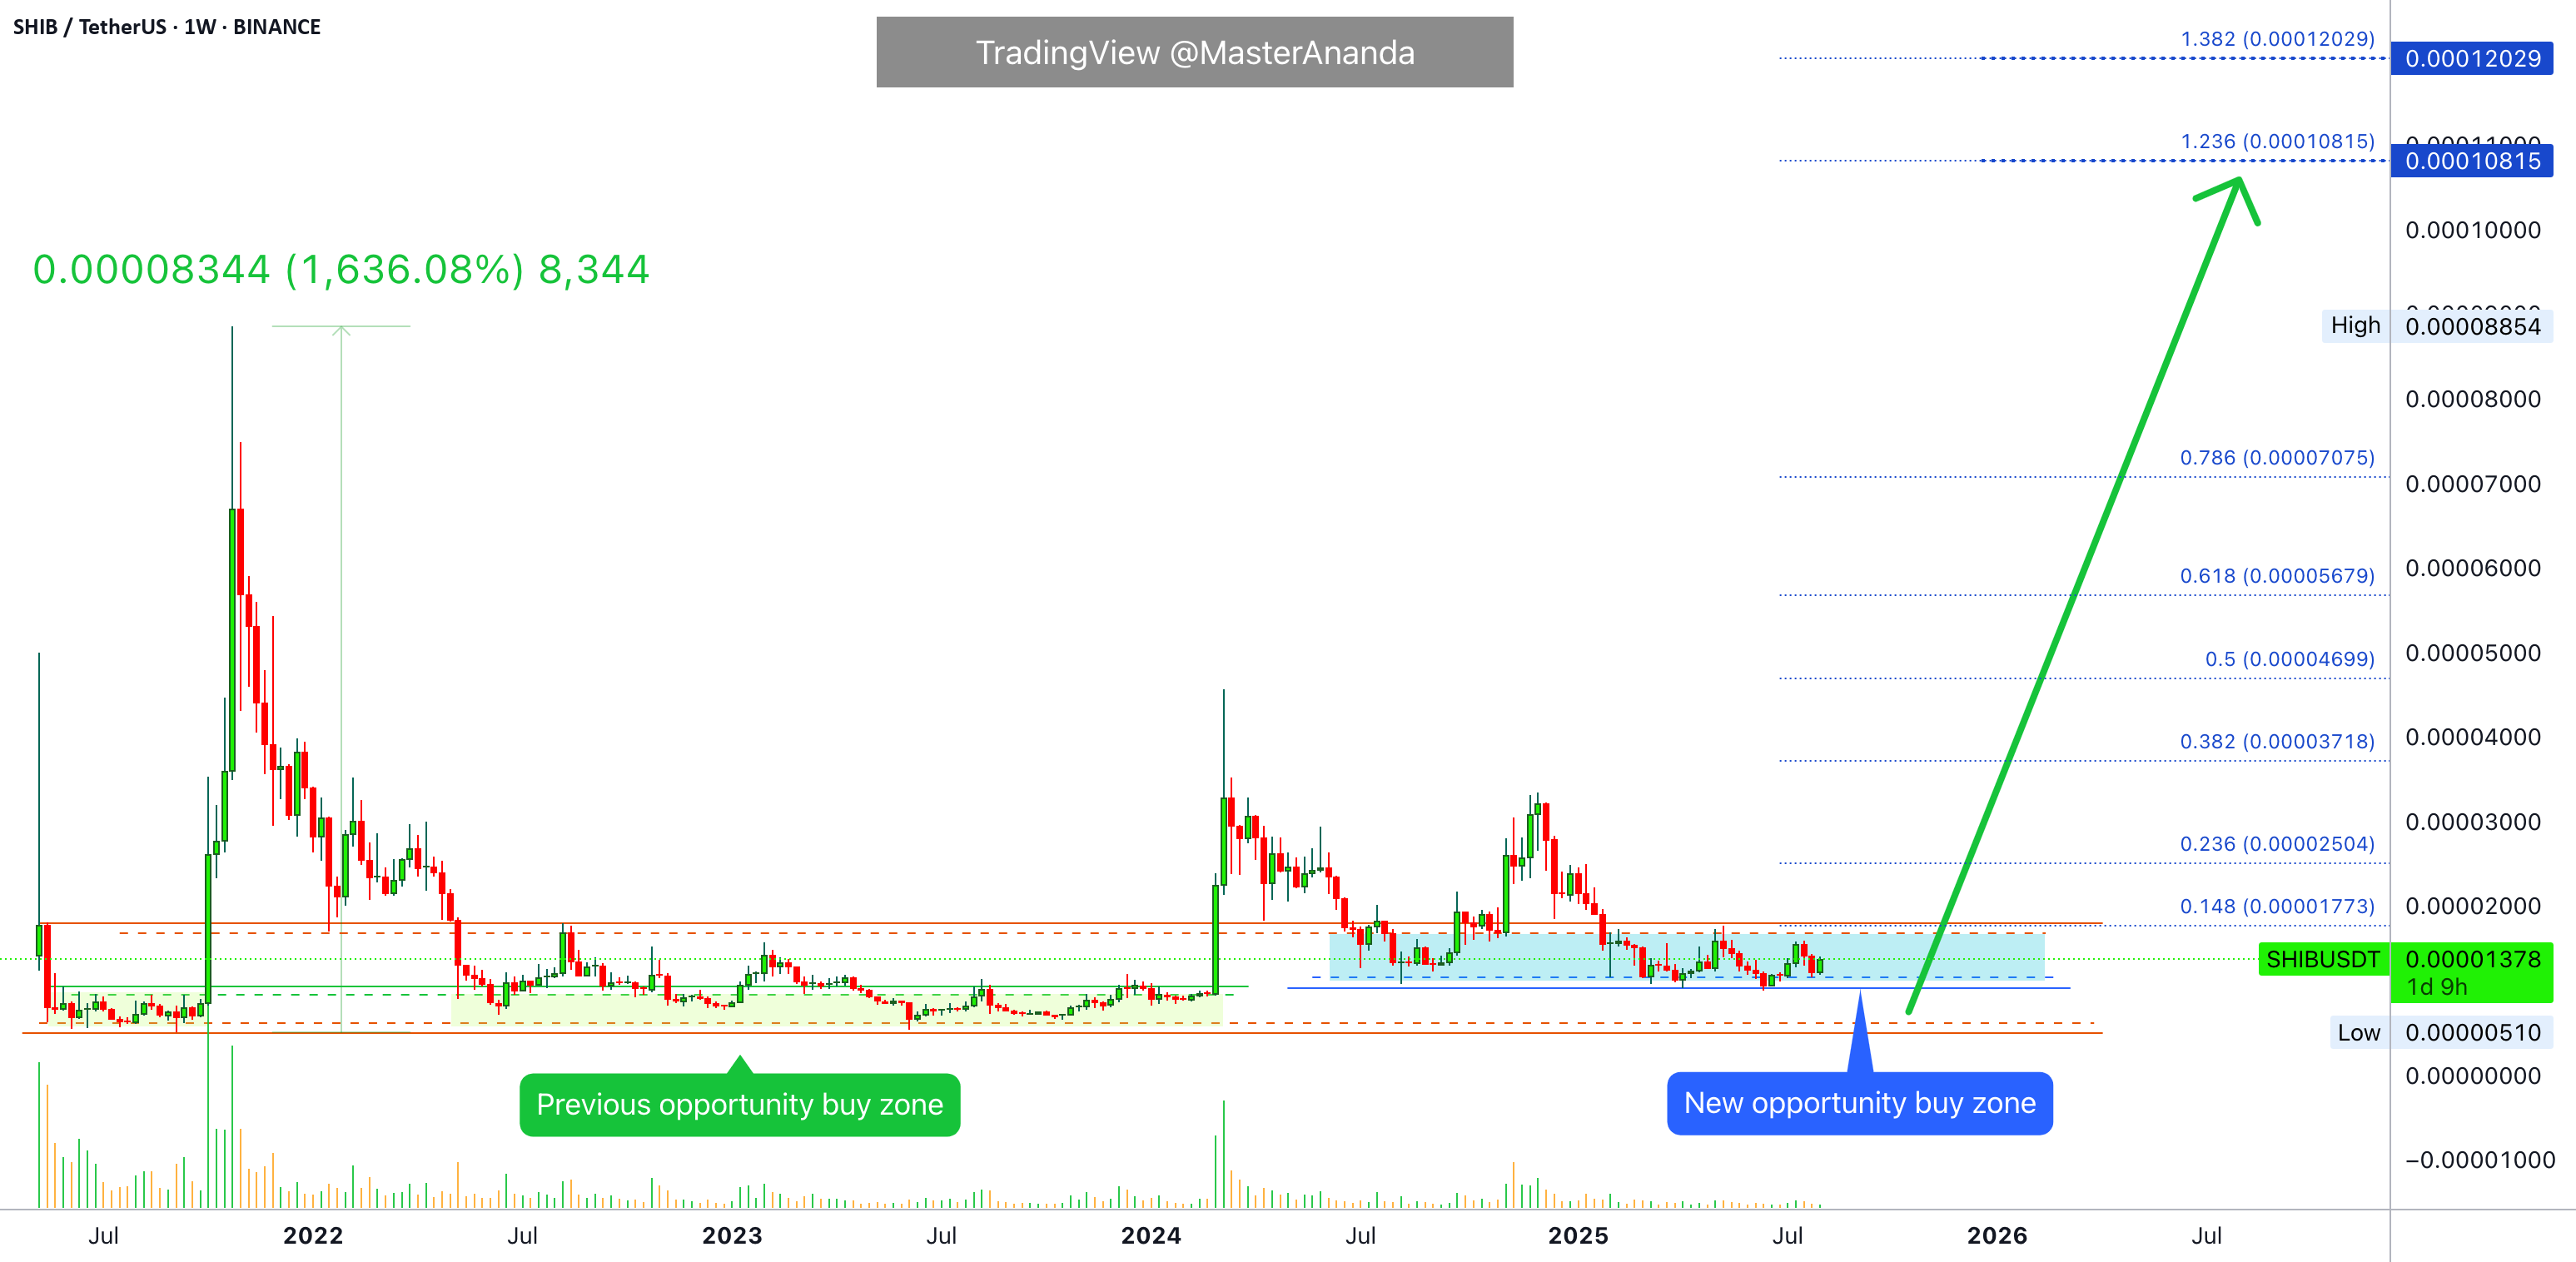
Other Analyst Predicts Shiba Inu's Price
In a separate analysis, a pseudonymous analyst, Best Crypto, is anticipating a bullish move for Shiba Inu, highlighting strong accumulation and favorable market trends on the weekly chart.
Notably, Shiba Inu's first resistance zone stands at 0.00001678, and a point of control (POC) level is highlighted at 0.00002527. An additional resistance appears at 0.00003329. For context, Shiba Inu has not traded above 0.00003 since December 5, 2024.
A breakout above the first resistance level and POC could lead toward the annotated triangle target of 0.00015, representing a new all-time high. From the current price, that move would represent a gain of approximately 1,053%. For context, Shiba Inu's all-time high was 0.00008616, recorded in October 2021.
RSI Points to Shiba Inu's Bullish and Bearish Scenarios
Interestingly, the chart also features the stochastic relative strength index (SRSI) and the standard RSI to assess momentum. Currently, both indicators are trading below thresholds, signaling that buying strength remains limited.
A bullish scenario could play out if SHIB secures a weekly close above the triangle’s upper boundary at the first resistance, ideally accompanied by the RSI crossing 50 and the SRSI trending higher. This would validate the measured move projection toward $0.000150.
In contrast, a bearish outcome would be triggered if the price closes below the ascending trendline or drops under S1, potentially opening the way for deeper declines toward lower support levels.
Other Analyst Predicts Shiba Inu's Price
In a separate analysis, a pseudonymous analyst, Best Crypto, is anticipating a bullish move for Shiba Inu, highlighting strong accumulation and favorable market trends on the weekly chart.
By:
