BTCC
/
BTCC Square
/
Thecryptobasic
/
Shiba Inu Roars: Analyst Pinpoints Two Profit-Taking Targets as Bullish Breakout Confirms Volume Zone Close
Shiba Inu Roars: Analyst Pinpoints Two Profit-Taking Targets as Bullish Breakout Confirms Volume Zone Close

17
1
Shiba Inu's latest price action has traders barking up the right tree—a decisive close inside a key volume zone signals the meme coin's next leg up.
Here's where to cash in before the hype cycle flips.
The breakout playbook
Two clear profit targets emerge from the chart structure, offering disciplined traders exit points before the usual 'buy high, sell low' crowd piles in.
Volume whispers what price shouts
The confirmed volume zone close isn't just technical noise—it's the kind of institutional-grade signal that separates diamond paws from paper hands.
Just don't tell the 'fundamental analysis' crypto bros—they're still drawing lines on JPEG whitepapers.
 Shiba Inu price analysisShiba Inu price analysis
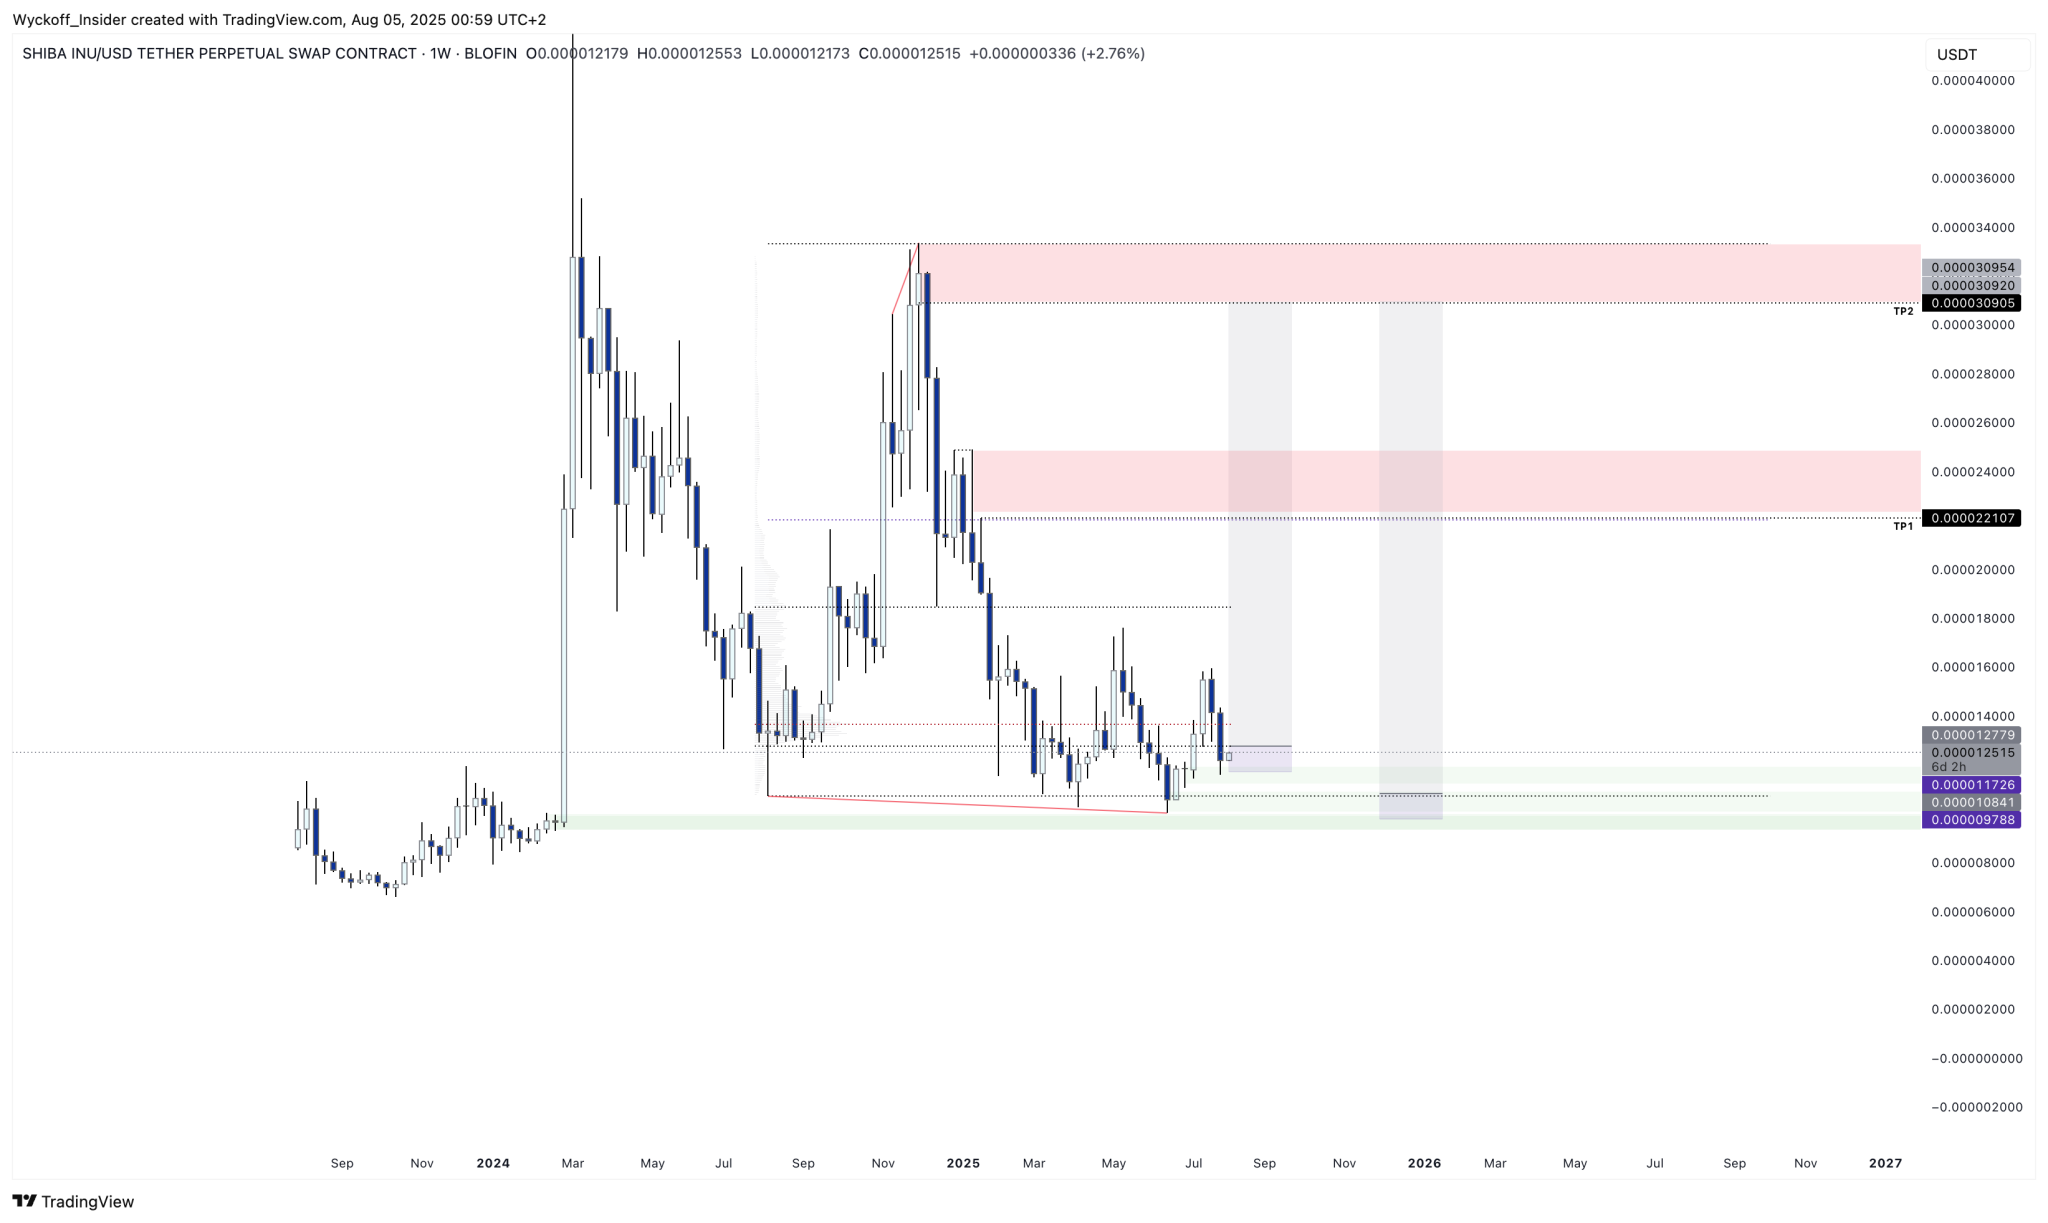
This technical pattern typically indicates renewed buyer interest after a consolidation phase. Notably, the analysis outlines a long entry strategy, with the stop-loss placed just below the Last Point of Support, the final low that forms before a potential upward trend begins.
Accumulation Zone Provides Support Structure for SHIB
On the chart, SHIB has repeatedly tested a support zone between $0.000009788 and $0.000011726. This area has historically acted as a base for accumulation, where buyers absorb selling pressure. The chart also shows long wicks below this zone, suggesting failed breakdown attempts and increased demand at lower levels.
The Last Point of Support rests between $0.000011726 and $0.000011841. Wyckoff Insider recommends placing a stop-loss just below this level to manage downside risk if the structure fails.
SHIBA INU's Upside Targets: $0.000022 and $0.000039
If the price holds above the support zone and continues upward, the first target is $0.000022107. This level coincides with previous resistance from late 2024. The second target is $0.000039005, which reflects the top of a larger supply zone formed during the peak rally.
Both levels represent key price points where SHIB faced historical selling pressure. Traders are watching for confirmation that the token can break through these zones and sustain higher prices.
Analyst Predicts shiba inu Rally
Despite the recent loss, analysts remain optimistic. Joe Swanson pointed to a developing cup-and-handle pattern on the daily chart, formed after SHIB rebounded from a June low of $0.00001002 to a July high of $0.00001597.
He noted that the current pullback represents the handle, signaling a potential breakout. With ongoing whale accumulation, Swanson projected a 70% rally toward $0.00002150 once SHIB clears the pattern’s neckline at $0.00001715.
Despite this sentiment, Shiba Inu, currently ranked 22nd with a market cap of $7.26 billion and trading at $0.00001233, has slipped out of the top 20 cryptocurrencies, marking a significant decline from its former top 10 glory in 2021 and again briefly in 2024.
Internal conflicts, anonymous leadership, and lack of institutional backing have all contributed to its downfall. While projects like Dogecoin have attracted ETF interest, SHIB remains retail-driven and burdened by an enormous token supply of 589 trillion.
Despite the setbacks, the Shiba Inu team remains optimistic, with figures like Lucie encouraging long-term holders and hinting at ambitious price goals, including the dream of hitting $0.01.
Shiba Inu price analysisShiba Inu price analysis
This technical pattern typically indicates renewed buyer interest after a consolidation phase. Notably, the analysis outlines a long entry strategy, with the stop-loss placed just below the Last Point of Support, the final low that forms before a potential upward trend begins.
Accumulation Zone Provides Support Structure for SHIB
On the chart, SHIB has repeatedly tested a support zone between $0.000009788 and $0.000011726. This area has historically acted as a base for accumulation, where buyers absorb selling pressure. The chart also shows long wicks below this zone, suggesting failed breakdown attempts and increased demand at lower levels.
The Last Point of Support rests between $0.000011726 and $0.000011841. Wyckoff Insider recommends placing a stop-loss just below this level to manage downside risk if the structure fails.
SHIBA INU's Upside Targets: $0.000022 and $0.000039
If the price holds above the support zone and continues upward, the first target is $0.000022107. This level coincides with previous resistance from late 2024. The second target is $0.000039005, which reflects the top of a larger supply zone formed during the peak rally.
Both levels represent key price points where SHIB faced historical selling pressure. Traders are watching for confirmation that the token can break through these zones and sustain higher prices.
Analyst Predicts shiba inu Rally
Despite the recent loss, analysts remain optimistic. Joe Swanson pointed to a developing cup-and-handle pattern on the daily chart, formed after SHIB rebounded from a June low of $0.00001002 to a July high of $0.00001597.
He noted that the current pullback represents the handle, signaling a potential breakout. With ongoing whale accumulation, Swanson projected a 70% rally toward $0.00002150 once SHIB clears the pattern’s neckline at $0.00001715.
Despite this sentiment, Shiba Inu, currently ranked 22nd with a market cap of $7.26 billion and trading at $0.00001233, has slipped out of the top 20 cryptocurrencies, marking a significant decline from its former top 10 glory in 2021 and again briefly in 2024.
Internal conflicts, anonymous leadership, and lack of institutional backing have all contributed to its downfall. While projects like Dogecoin have attracted ETF interest, SHIB remains retail-driven and burdened by an enormous token supply of 589 trillion.
Despite the setbacks, the Shiba Inu team remains optimistic, with figures like Lucie encouraging long-term holders and hinting at ambitious price goals, including the dream of hitting $0.01.
By:
Previous
XRP Price Predictions for 2030: Bitwise’s Bold Forecast Unveiled
Next
Trump to Sign Landmark Executive Order Protecting Crypto Firms from Bank Discrimination
