BTCC
/
BTCC Square
/
Thecryptobasic
/
🚀 Dogecoin Roars Back: Double Bottom Breakout Confirms Bullish Reversal
🚀 Dogecoin Roars Back: Double Bottom Breakout Confirms Bullish Reversal

11
3
Dogecoin just flipped the script—again. The meme coin that Wall Street loves to hate just printed a textbook double bottom breakout, signaling a potential rally ahead.
Technical breakout or meme magic?
DOGE's chart now shows the classic reversal pattern after months of sideways action. No fancy indicators needed—just pure price action confirming what traders suspected: the dip-buyers are back.
The cynical take
Meanwhile, traditional finance analysts are still arguing whether a Shiba Inu-themed cryptocurrency deserves a market cap larger than some banks. (Spoiler: it does, and it's not even close.)
Next resistance levels loom, but for now—the dogs are barking.
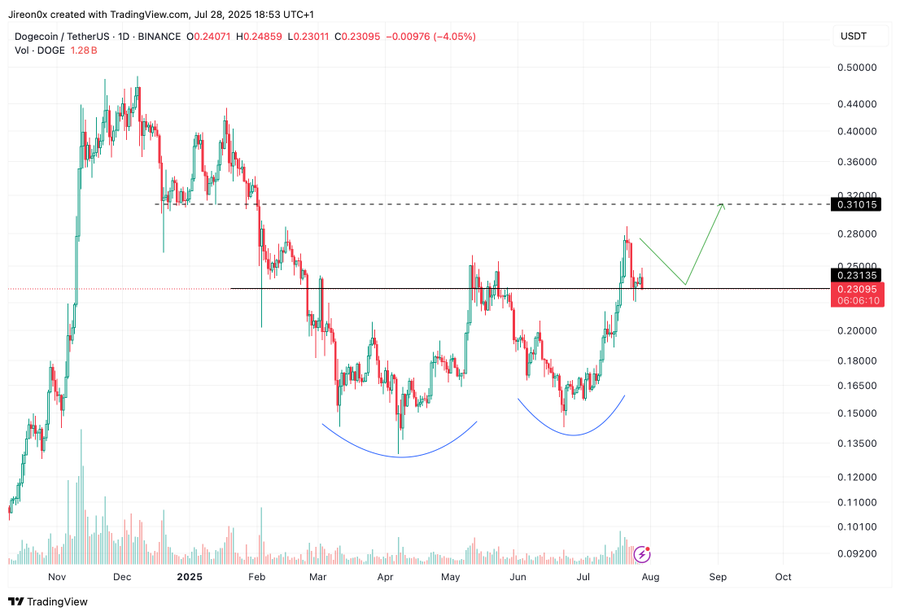 Jireon described the setup as a textbook double bottom pattern, adding that the current price action suggests a bullish continuation may follow.
The first bottom formed in April when DOGE dipped to about $0.130. After attempting a recovery and getting rejected at higher levels, the second bottom formed around July 5, once again touching the $0.15 region.
This second test of the same support zone, followed by a strong bounce, validated the formation of the double bottom, a pattern often considered a precursor to bullish trend shifts.
The neckline of the pattern was clearly established around $0.231, which had acted as a resistance level throughout the consolidation phase.
On July 25, Dogecoin convincingly broke above this neckline with a daily close well above $0.231, accompanied by a noticeable uptick in trading volume of $4 billion, a key requirement for confirming breakout strength.
As of now, the price has pulled back to retest the neckline, hovering just around the $0.231 zone. This retest is a critical moment; if DOGE holds this level and bounces, it would likely confirm the breakout and pave the way toward the next resistance at $0.310.
At this press time, DOGE is trading at $0.2303, a 4.9% decline in the past day. Despite the 13.8% decline in the past week, Dogecoin still boasts a 40.6% rise in the past month.
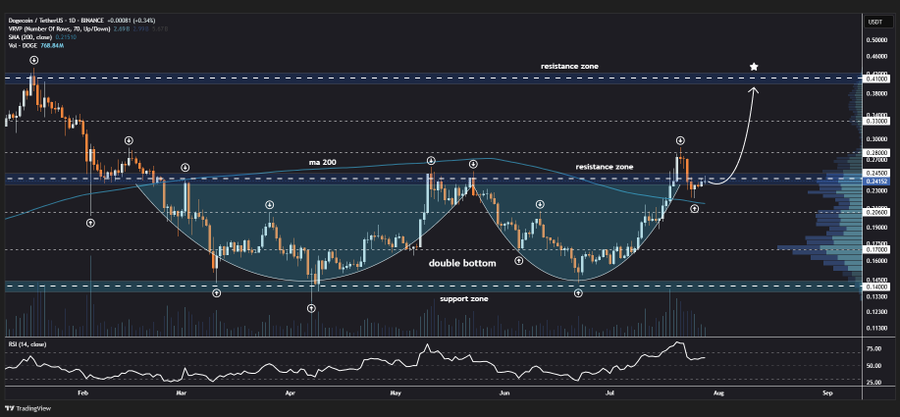
Momentum Builds Above the 200-Day Moving Average.
Fellow analyst Jonathan Carter added further validation to the breakout signal. In a separate analysis, Carter explained that Dogecoin was holding above its neckline and bounced off the 200-day moving average. This widely recognized technical indicator often defines long-term trend direction.
Jireon described the setup as a textbook double bottom pattern, adding that the current price action suggests a bullish continuation may follow.
The first bottom formed in April when DOGE dipped to about $0.130. After attempting a recovery and getting rejected at higher levels, the second bottom formed around July 5, once again touching the $0.15 region.
This second test of the same support zone, followed by a strong bounce, validated the formation of the double bottom, a pattern often considered a precursor to bullish trend shifts.
The neckline of the pattern was clearly established around $0.231, which had acted as a resistance level throughout the consolidation phase.
On July 25, Dogecoin convincingly broke above this neckline with a daily close well above $0.231, accompanied by a noticeable uptick in trading volume of $4 billion, a key requirement for confirming breakout strength.
As of now, the price has pulled back to retest the neckline, hovering just around the $0.231 zone. This retest is a critical moment; if DOGE holds this level and bounces, it would likely confirm the breakout and pave the way toward the next resistance at $0.310.
At this press time, DOGE is trading at $0.2303, a 4.9% decline in the past day. Despite the 13.8% decline in the past week, Dogecoin still boasts a 40.6% rise in the past month.
Momentum Builds Above the 200-Day Moving Average.
Fellow analyst Jonathan Carter added further validation to the breakout signal. In a separate analysis, Carter explained that Dogecoin was holding above its neckline and bounced off the 200-day moving average. This widely recognized technical indicator often defines long-term trend direction.
By:
Previous
XRP Primed for 600% Mega Pump—Top Analyst Exposes the Trigger
Next
Cardano Founder Declares ADA Outshines Bitcoin as the Ultimate Crypto Investment in 2025
