BTCC
/
BTCC Square
/
Thecryptobasic
/
Bitcoin’s Decade-Defining Breakout: What This Means for BTC Price in 2025
Bitcoin’s Decade-Defining Breakout: What This Means for BTC Price in 2025

8
3
Bitcoin just triggered its most bullish signal since the last halving—and traditional finance isn’t ready.
The Setup:
A veteran analyst spots a technical pattern so rare, it’s only appeared twice in BTC’s history. Both times, price multiplied by triple digits within 24 months.
The Punchline:
This breakout coincides with Wall Street’s latest attempt to ‘tame’ crypto via ETFs—while quietly accumulating positions. The irony’s thicker than a banker’s bonus.
The Play:
Watch the $100K psychological barrier. If liquidity floods in like 2017 and 2021, the ensuing FOMO could make those rallies look timid. Just don’t expect CNBC to admit it until after the fact.
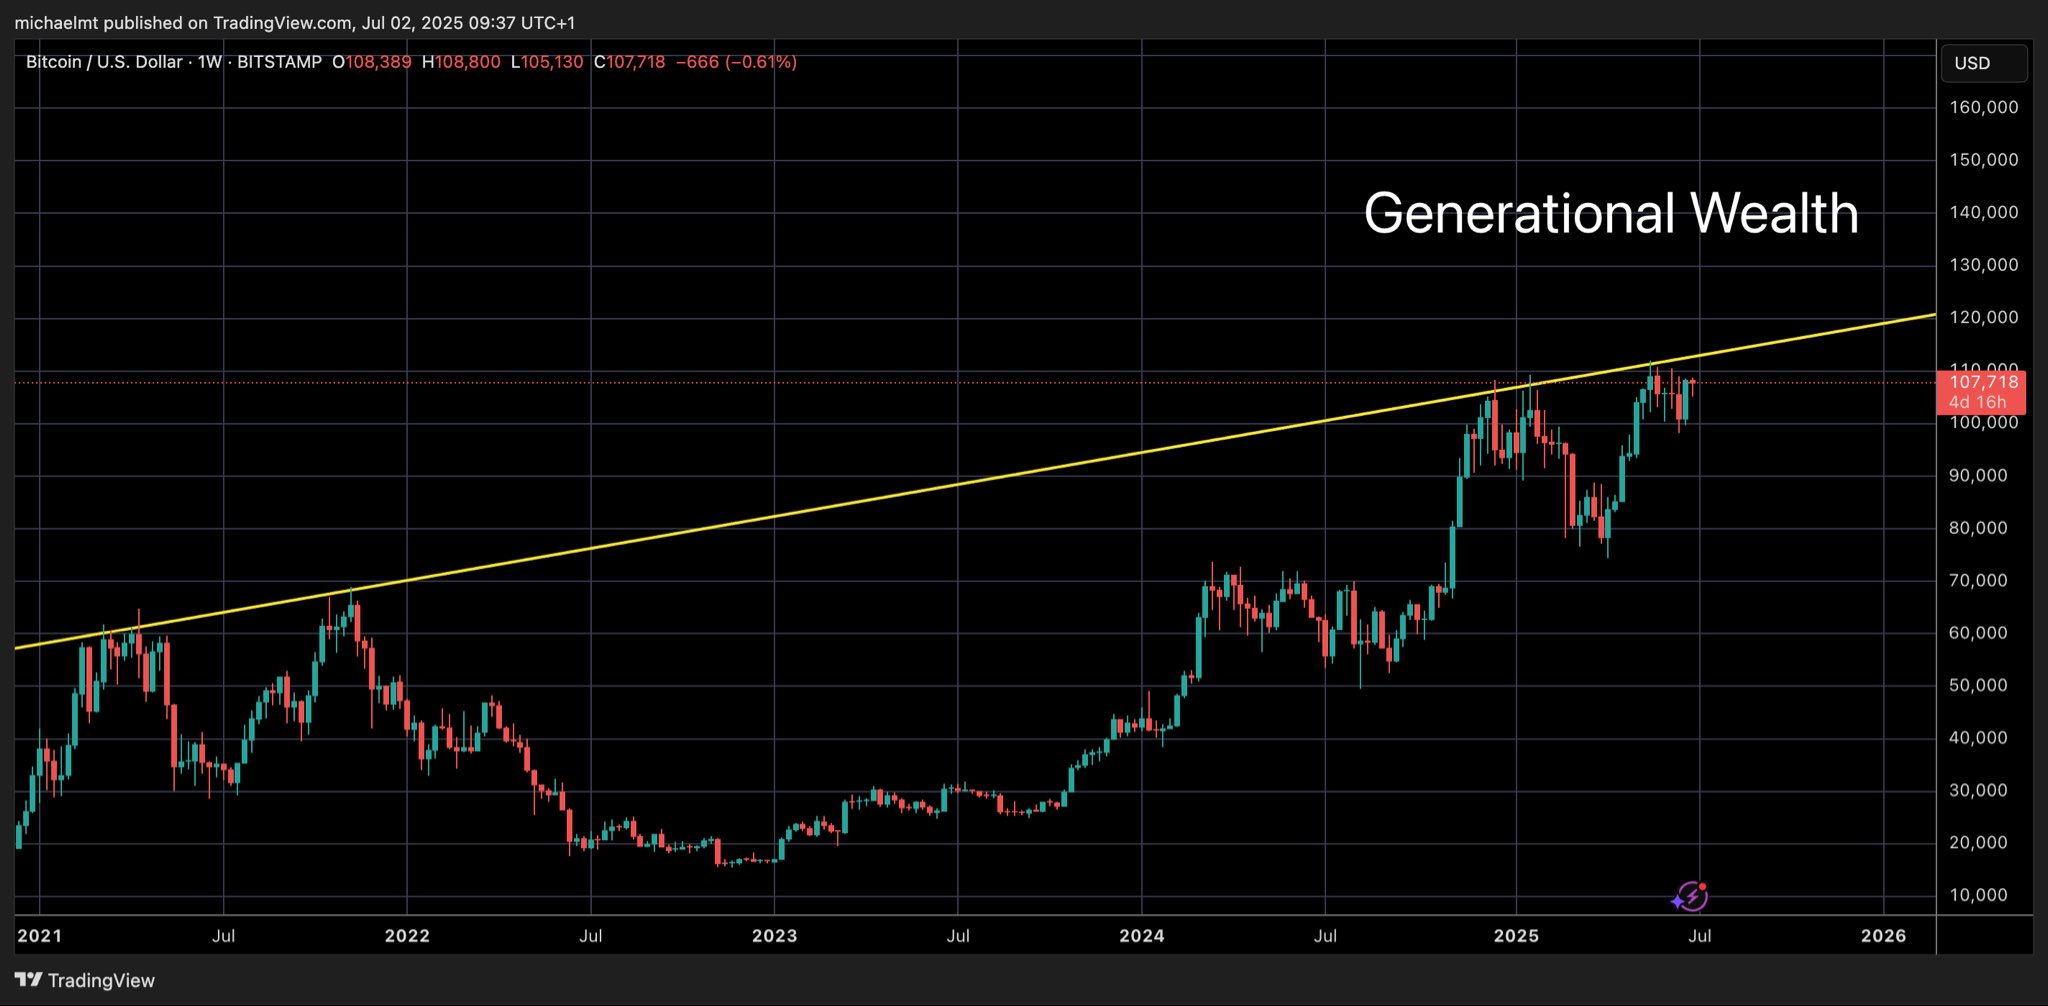 The first test of this resistance took place on April 12, 2021, when Bitcoin's price reached $64,962. Following this attempt, Bitcoin's price dropped significantly, falling below $29,000 by June 21, 2021.
Bitcoin faced another rejection after testing the resistance again on November 8, 2021, when the price reached $69,035, before it dropped to around $15,000. These early failures at the trend line highlighted its strength as a barrier.
Recent Tests and Breakout Possibilities
Despite the previous setbacks, bitcoin has continued to test the same resistance level. The next attempt occurred on December 16, 2024, when Bitcoin's price broke above the resistance to touch $108,200.
However, the bullish momentum was short-lived, and another attempt on December 20 saw Bitcoin reach $109,300. Despite these fluctuations, Bitcoin continued to test the resistance, and on May 19, 2025, Bitcoin briefly hit its all-time high of $111,800, although it was rejected there by the same trendline.
Michael believes that once Bitcoin breaks through its key resistance trend-line, those sidelined in the market could miss out on what could be the "breakout of the decade."
Interestingly, the analyst agreed with a commenter who noted that many traders have lost hope, which only makes him more bullish on Bitcoin’s future. According to the commenter, this typical market behavior suggests that while the everyday trader may be fearful, the market is setting up for a substantial upward run.
Where is Bitcoin Headed
At the same time, The Crypto Basic recently called attention to an analyst who provided a timeline for Bitcoin to reach specific levels. Leo Heart's analysis uses a rainbow logarithmic regression model to project Bitcoin's price following each halving event, indicating significant post-halving increases.
Based on this model, Bitcoin's price by 2029 is projected to range between $122,372 and $509,090. Heart predicts Bitcoin will remain below $120,000 until the end of 2028, with a price range of $137,000 to $165,000 by the end of 2025.
The first test of this resistance took place on April 12, 2021, when Bitcoin's price reached $64,962. Following this attempt, Bitcoin's price dropped significantly, falling below $29,000 by June 21, 2021.
Bitcoin faced another rejection after testing the resistance again on November 8, 2021, when the price reached $69,035, before it dropped to around $15,000. These early failures at the trend line highlighted its strength as a barrier.
Recent Tests and Breakout Possibilities
Despite the previous setbacks, bitcoin has continued to test the same resistance level. The next attempt occurred on December 16, 2024, when Bitcoin's price broke above the resistance to touch $108,200.
However, the bullish momentum was short-lived, and another attempt on December 20 saw Bitcoin reach $109,300. Despite these fluctuations, Bitcoin continued to test the resistance, and on May 19, 2025, Bitcoin briefly hit its all-time high of $111,800, although it was rejected there by the same trendline.
Michael believes that once Bitcoin breaks through its key resistance trend-line, those sidelined in the market could miss out on what could be the "breakout of the decade."
Interestingly, the analyst agreed with a commenter who noted that many traders have lost hope, which only makes him more bullish on Bitcoin’s future. According to the commenter, this typical market behavior suggests that while the everyday trader may be fearful, the market is setting up for a substantial upward run.
Where is Bitcoin Headed
At the same time, The Crypto Basic recently called attention to an analyst who provided a timeline for Bitcoin to reach specific levels. Leo Heart's analysis uses a rainbow logarithmic regression model to project Bitcoin's price following each halving event, indicating significant post-halving increases.
Based on this model, Bitcoin's price by 2029 is projected to range between $122,372 and $509,090. Heart predicts Bitcoin will remain below $120,000 until the end of 2028, with a price range of $137,000 to $165,000 by the end of 2025.
By:
Previous
Corporate Bitcoin Buying Spree: Public Companies Outpace ETFs 2:1 in H1 2025
Next
BlackRock’s Bitcoin ETF Smashes Records: $75B+ ATH Valuation With 696,874 BTC Holdings
