BTCC
/
BTCC Square
/
Thecryptobasic
/
Bitcoin’s $169K Cup-and-Handle Target Confirmed—Brace for Liftoff
Bitcoin’s $169K Cup-and-Handle Target Confirmed—Brace for Liftoff

16
1
Bitcoin just painted the most bullish chart pattern in finance—and traditional investors are still pretending it's a 'bubble.'
The king of crypto completed its textbook cup-and-handle formation this week, triggering what analysts call a 'generational buy signal.' Price targets now cluster around $169,000—a figure that'd make gold bugs choke on their inflation hedges.
Technical traders are loading up while Wall Street debates whether to 'allocate 1%' to digital assets. Meanwhile, the pattern suggests we're not just retesting all-time highs—we're rewriting the playbook for store-of-value assets.
Funny how the same institutions dismissing BTC in 2025 will be paying seven-figure compliance teams to 'discover' it in 2026.
 Bitcoin Price PredictionBitcoin Price Prediction
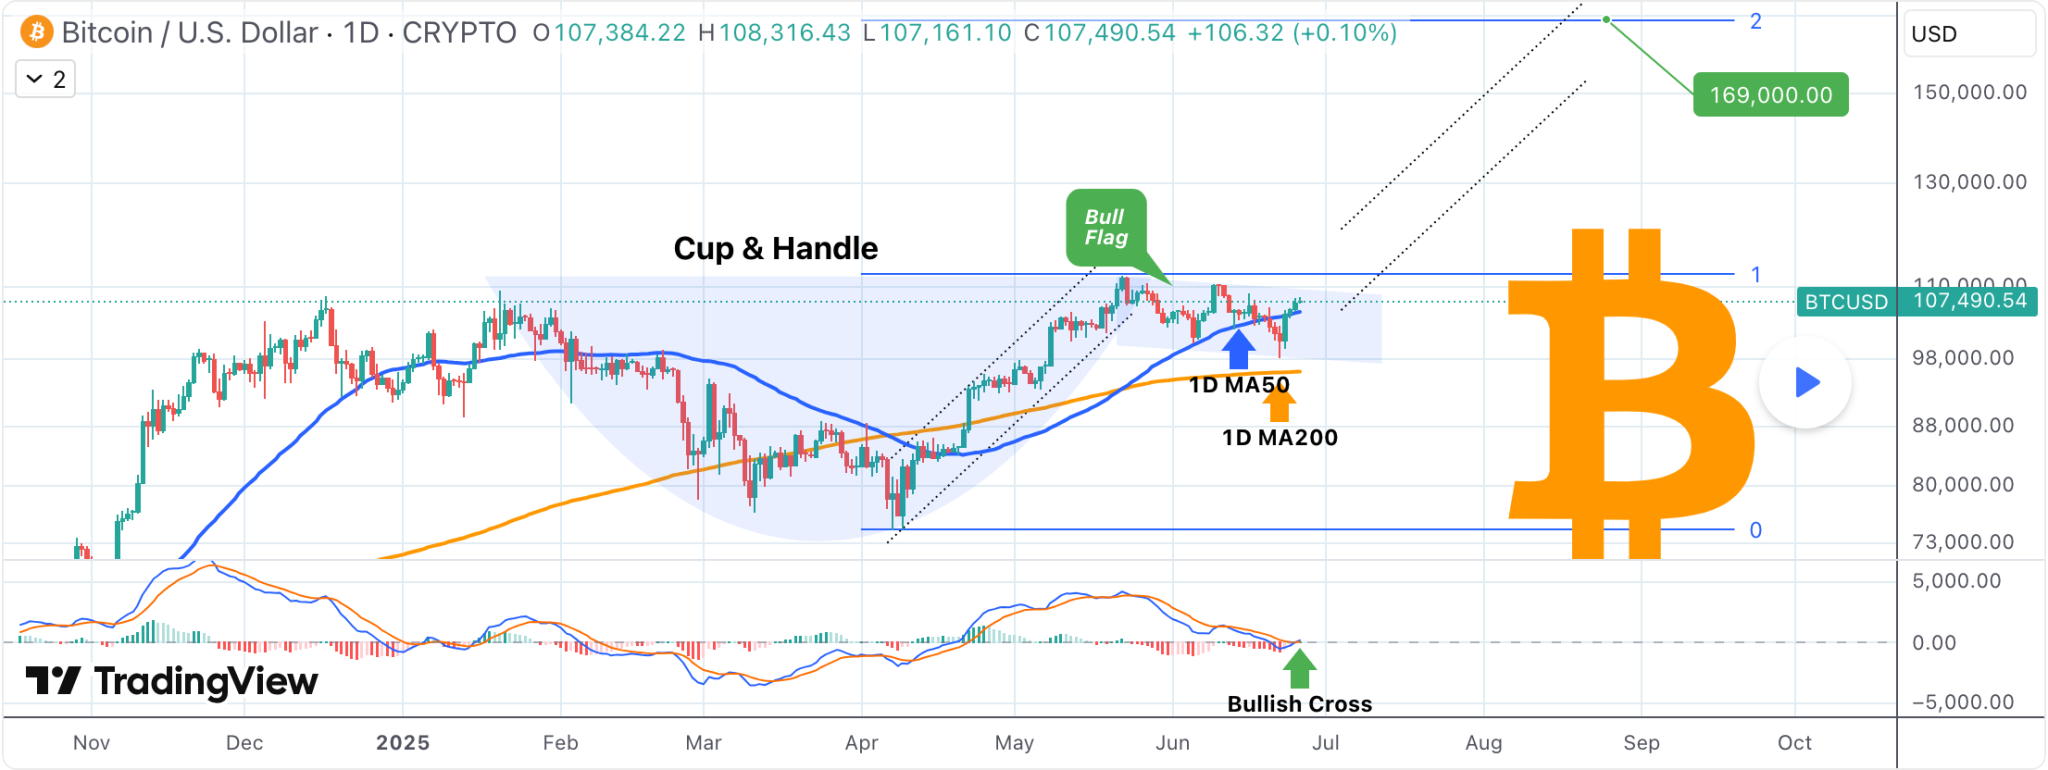
The rebound that extended into May reached as high as $111,800 around May 22, which marked the right edge of the cup.
After that, price action ranged between $98,300 and $110,700, shaping the handle. This period of consolidation coincided with bitcoin dipping below its 1D MA50. After this, it rebounded at the 1D MA200, a move noted by the analyst as significant for the technical setup.
Technical Indicators Signal Building Momentum
According to TradingShot, Bitcoin not only reclaimed its 1D MA50 following the rebound but also posted a bullish signal on the MACD. The Moving Average Convergence Divergence (MACD) indicator printed a Bullish Cross, with the MACD line crossing above the signal line. This development typically points to strengthening bullish momentum and supports the possibility of further gains.
The MACD crossover aligns with Bitcoin regaining its MA50, reinforcing the bullish outlook based on the completed chart pattern. Importantly, the handle segment of the cup and handle pattern has formed what the analyst refers to as an “isolated” Bull Flag. The chart projects a technical target at the 2.0 Fibonacci extension, situated at approximately $169,000.
To meet the projected level of $169,000, Bitcoin would require a 57.47% increase from the current pivot level of $107,316.
Bitcoin Has Room for Upside
Meanwhile, Julien Bittel, head of macro research at Global Macro Investor (GMI), shared an updated chart on June 25 showing Bitcoin’s historical correlation with global M2 liquidity, which now stands at $94.3 trillion. The chart highlights that Bitcoin has generally followed M2 trends with a 12-week lag, maintaining a broad alignment since 2023 despite occasional deviations.
Currently, Bitcoin appears to be trailing the growth in global liquidity, creating a divergence that analysts are watching. This macro backdrop, paired with bullish technical signals such as the MACD crossover and the recovery of key moving averages, suggests Bitcoin may still have room to follow global M2’s upward path and approach projected cycle targets.
Bitcoin Price PredictionBitcoin Price Prediction
The rebound that extended into May reached as high as $111,800 around May 22, which marked the right edge of the cup.
After that, price action ranged between $98,300 and $110,700, shaping the handle. This period of consolidation coincided with bitcoin dipping below its 1D MA50. After this, it rebounded at the 1D MA200, a move noted by the analyst as significant for the technical setup.
Technical Indicators Signal Building Momentum
According to TradingShot, Bitcoin not only reclaimed its 1D MA50 following the rebound but also posted a bullish signal on the MACD. The Moving Average Convergence Divergence (MACD) indicator printed a Bullish Cross, with the MACD line crossing above the signal line. This development typically points to strengthening bullish momentum and supports the possibility of further gains.
The MACD crossover aligns with Bitcoin regaining its MA50, reinforcing the bullish outlook based on the completed chart pattern. Importantly, the handle segment of the cup and handle pattern has formed what the analyst refers to as an “isolated” Bull Flag. The chart projects a technical target at the 2.0 Fibonacci extension, situated at approximately $169,000.
To meet the projected level of $169,000, Bitcoin would require a 57.47% increase from the current pivot level of $107,316.
Bitcoin Has Room for Upside
Meanwhile, Julien Bittel, head of macro research at Global Macro Investor (GMI), shared an updated chart on June 25 showing Bitcoin’s historical correlation with global M2 liquidity, which now stands at $94.3 trillion. The chart highlights that Bitcoin has generally followed M2 trends with a 12-week lag, maintaining a broad alignment since 2023 despite occasional deviations.
Currently, Bitcoin appears to be trailing the growth in global liquidity, creating a divergence that analysts are watching. This macro backdrop, paired with bullish technical signals such as the MACD crossover and the recovery of key moving averages, suggests Bitcoin may still have room to follow global M2’s upward path and approach projected cycle targets.
By:
Previous
Shiba Inu Stalls as SEC Puts Meme Coin ETF Under Microscope—What’s Next for DOGE’s Rival?
Next
XRP Primed for Explosive Rally—$17.5 Target Now in Play
