BTCC
/
BTCC Square
/
Thecryptobasic
/
Bitcoin’s Surprising Correlation With This Key Metric Signals Major Upside Ahead
Bitcoin’s Surprising Correlation With This Key Metric Signals Major Upside Ahead

12
2
Bitcoin's price action is flashing bullish signals again—and this time, it's all about an under-the-radar metric that historically precedes big moves.
Here's why traders are betting on another leg up.
The correlation that cracks the code
When this metric zigged in the past, BTC zagged—and right now, it's screaming 'buy.' No fancy jargon, just cold hard patterns repeating.
Wall Street's missing the plot (again)
While traditional finance scrambles to explain the rally, crypto natives know: markets move faster than analyst reports. The 'smart money'? Still waiting for a permission slip.
One thing's clear—when this alignment happens, stagnation tends to follow... just before violent breakouts. Buckle up.
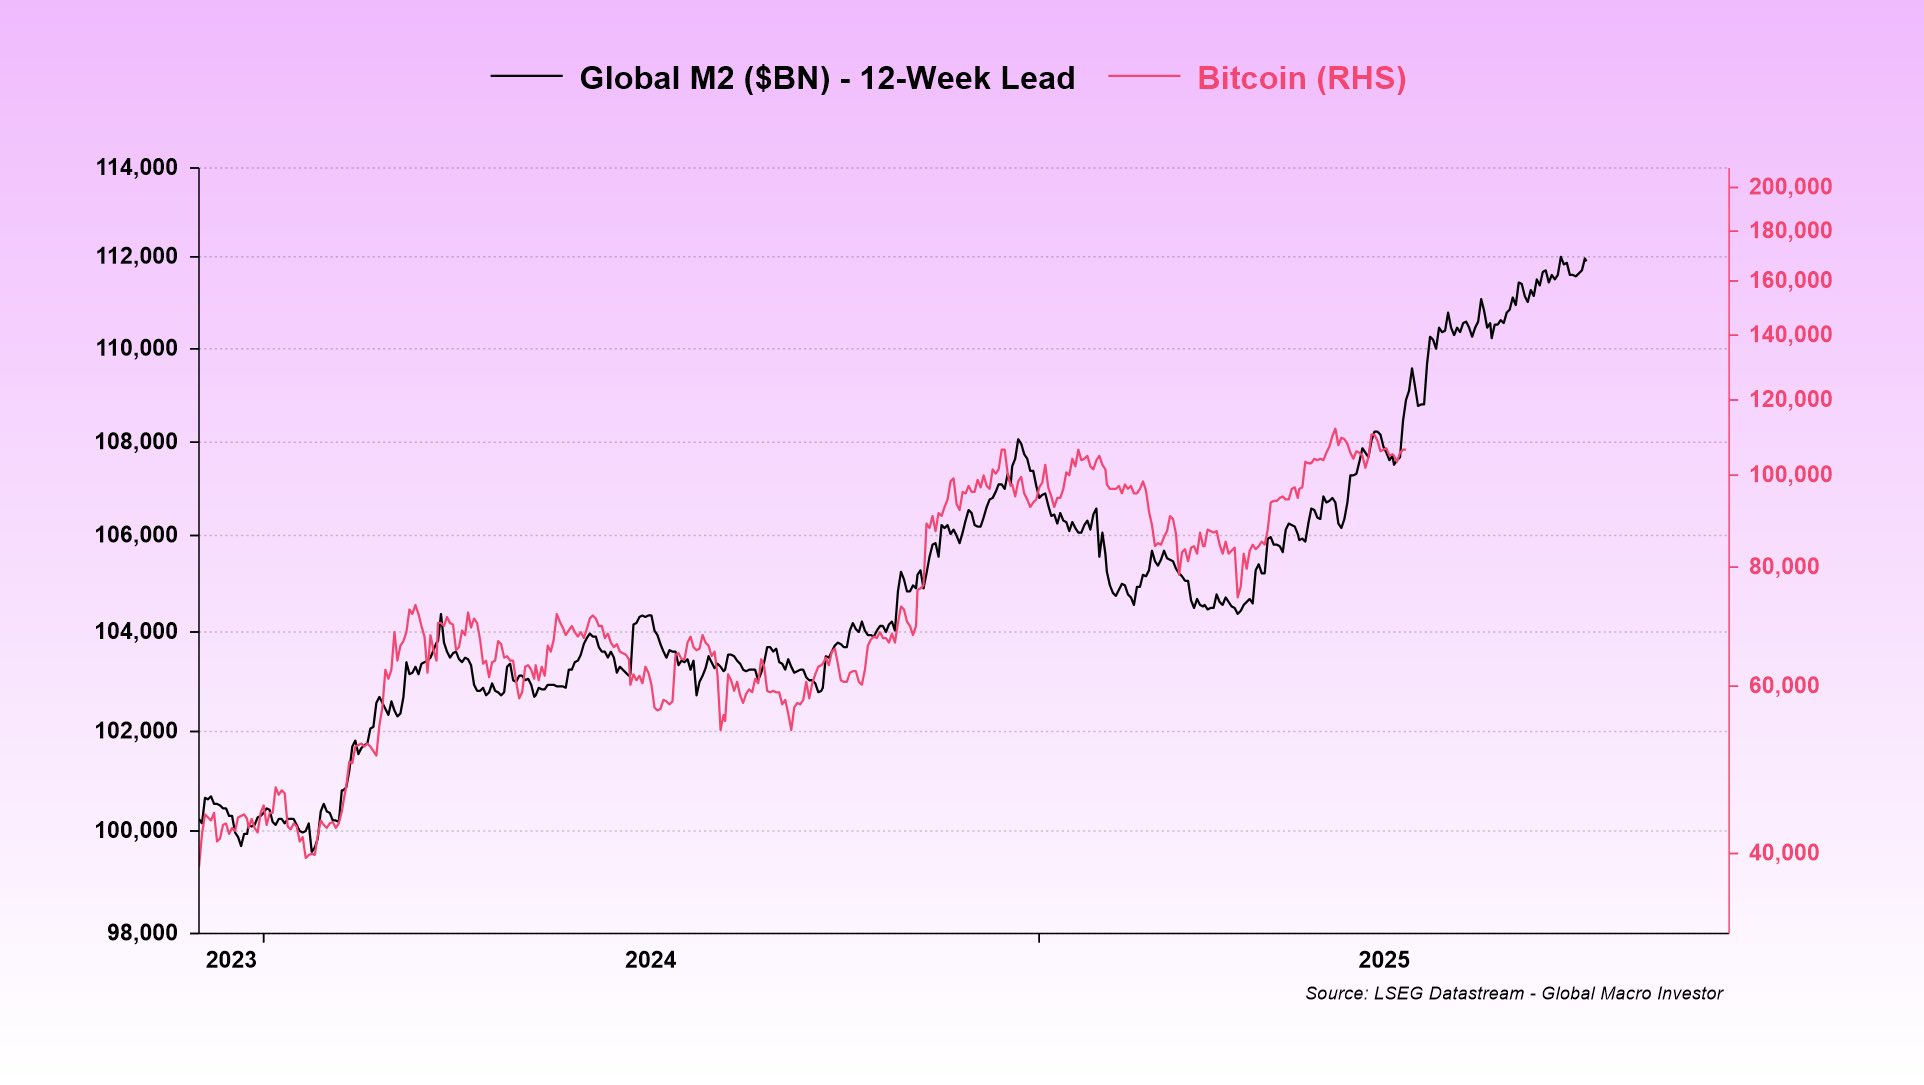 Bitcoin and Global M2 12-Week Lead Chart
It comprises liquidity from M1, which is physical cash, savings deposits, money market funds, and other forms of cash readily available for economic activities. Typically, a growth in global liquidity usually translates to an increase in investment appetite, favoring assets like Bitcoin.
Essentially, Bittel’s chart shows a close correlation between bitcoin and the M2 money supply. The two have closely followed each other’s trends since 2023. While they have occasionally decoupled, their relationship has remained largely intact.
Bitcoin Still Lagging Against Global M2
According to data, the global M2 liquidity stands at $94.3 trillion. Notably, the figures have been growing extensively lately, following quantitative easing in some major economies globally and money printing by the central banks of certain countries.
The chart shows that the global M2 has outgrown Bitcoin, suggesting that the crypto leader could follow its lead, considering their close correlation. Meanwhile, Bittel emphasized that the analysis is not about Bitcoin matching the global liquidity tick for tick, but rather an indication that the bullish momentum for BTC remains intact.
This suggests that Bitcoin could trend higher from current prices, potentially surpassing its all-time high of $112,000. While the analyst did not mention a precise target, earlier outlooks predict prices of $175,000, $200,000, and $250,000 by the end of the cycle.
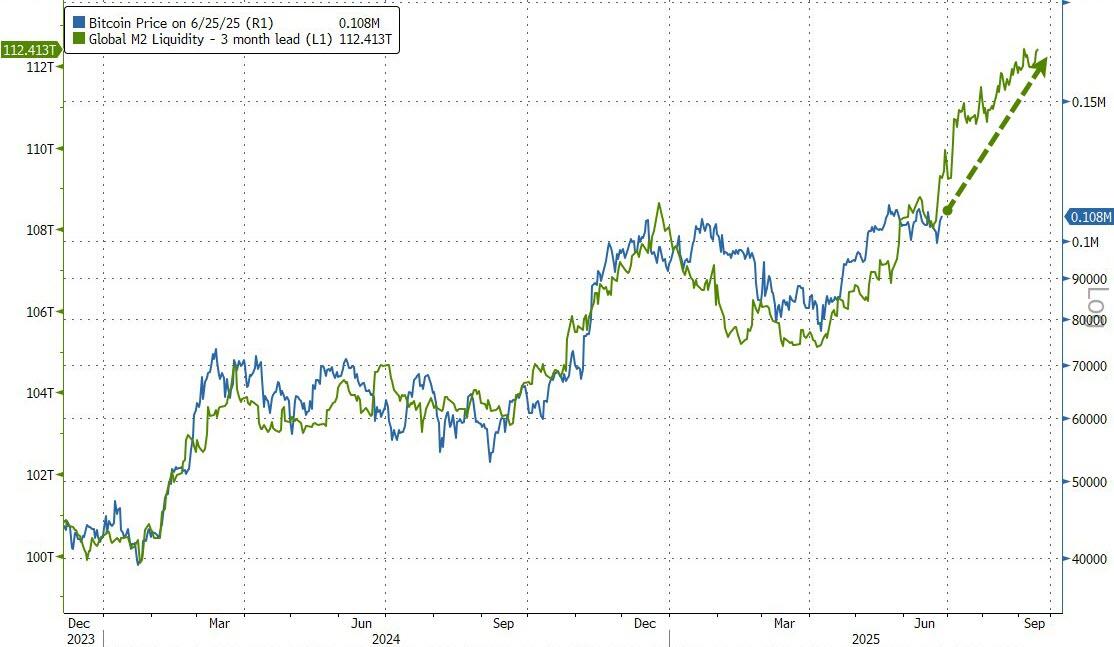
Moreover, analysis from Zero Hedge supports Bittel’s outlook. An accompanying chart also shows a correlation between Bitcoin and the global M2, suggesting that BTC may rally extensively from its current prices to close a highlighted performance gap.
Bitcoin and Global M2 12-Week Lead Chart
It comprises liquidity from M1, which is physical cash, savings deposits, money market funds, and other forms of cash readily available for economic activities. Typically, a growth in global liquidity usually translates to an increase in investment appetite, favoring assets like Bitcoin.
Essentially, Bittel’s chart shows a close correlation between bitcoin and the M2 money supply. The two have closely followed each other’s trends since 2023. While they have occasionally decoupled, their relationship has remained largely intact.
Bitcoin Still Lagging Against Global M2
According to data, the global M2 liquidity stands at $94.3 trillion. Notably, the figures have been growing extensively lately, following quantitative easing in some major economies globally and money printing by the central banks of certain countries.
The chart shows that the global M2 has outgrown Bitcoin, suggesting that the crypto leader could follow its lead, considering their close correlation. Meanwhile, Bittel emphasized that the analysis is not about Bitcoin matching the global liquidity tick for tick, but rather an indication that the bullish momentum for BTC remains intact.
This suggests that Bitcoin could trend higher from current prices, potentially surpassing its all-time high of $112,000. While the analyst did not mention a precise target, earlier outlooks predict prices of $175,000, $200,000, and $250,000 by the end of the cycle.
Moreover, analysis from Zero Hedge supports Bittel’s outlook. An accompanying chart also shows a correlation between Bitcoin and the global M2, suggesting that BTC may rally extensively from its current prices to close a highlighted performance gap.
By:
Previous
Shiba Inu’s Lead Dev Reveals: AI + Blockchain Are Reshaping Business—Like It or Not
Next
$12B+ XRP Exodus in 24 Hours: Exchange Outflow Myth or Market Shakeup?
