VeChain Tests $0.020 Support: Is a Drop to $0.017 Inevitable?

25
1
VeChain's price action is flashing warning signs as it hovers precariously above $0.020. Market watchers are bracing for a potential slide to $0.017—because what's crypto without its daily dose of volatility?
The $0.020 level has become a battleground between bulls and bears, with neither side showing clear dominance. Meanwhile, traders are left wondering if this is just another fakeout before the next leg down.
Technical indicators suggest weakening momentum, but let's be honest—when have crypto charts ever followed the textbook? One thing's certain: if traditional finance folks weren't already skeptical about crypto's price discovery, this VET performance isn't helping.
 VeChain Price Chart
Supporting the bearish outlook, the MACD and signal lines are trending downward within negative territory. Additionally, the daily RSI hovers between the oversold boundary and the midpoint, maintaining a bearish bias. Hence, momentum indicators project a bearish view for VeChain.
Fibonacci levels suggest the immediate price target is $0.017, based on the year-to-date low recorded on April 7. However, a potential reversal leading to a channel breakout could retest the 38.20% Fibonacci level at $0.031 if the price exceeds the $0.024 resistance level.
VeChain Derivatives
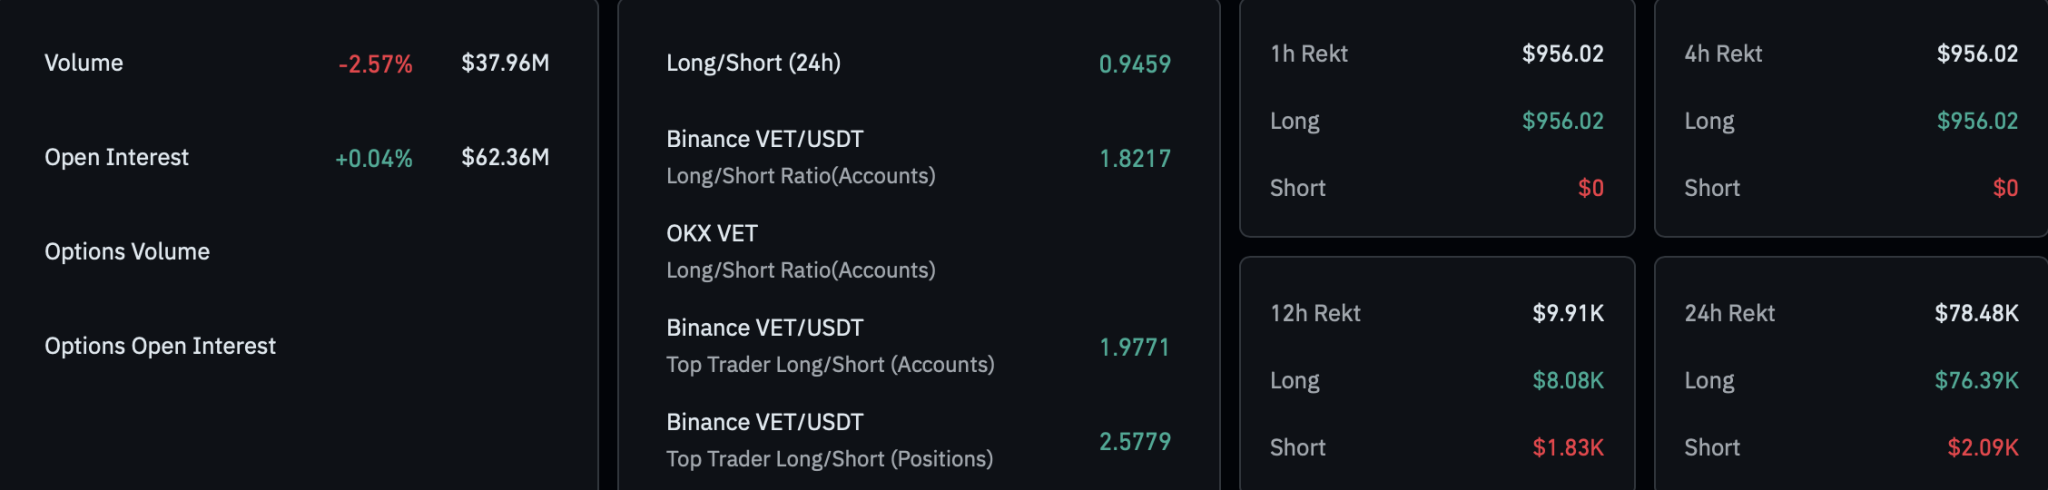
As VeChain clings to psychological support, the derivatives market remains quiet, with traders mostly on the sidelines. CoinGlass data shows VET open interest has seen marginal growth of 0.04%, reaching $62.36 million.
However, liquidation data reveal a wipeout of bullish traders worth $76,390 in long liquidations. In contrast, short liquidations were just $2,000, indicating that most wiped-out positions were bullish. This has lowered the long-to-short ratio to 0.9459 over the past 24 hours, indicating that active bearish positions outnumber long positions.
VeChain Price Chart
Supporting the bearish outlook, the MACD and signal lines are trending downward within negative territory. Additionally, the daily RSI hovers between the oversold boundary and the midpoint, maintaining a bearish bias. Hence, momentum indicators project a bearish view for VeChain.
Fibonacci levels suggest the immediate price target is $0.017, based on the year-to-date low recorded on April 7. However, a potential reversal leading to a channel breakout could retest the 38.20% Fibonacci level at $0.031 if the price exceeds the $0.024 resistance level.
VeChain Derivatives
As VeChain clings to psychological support, the derivatives market remains quiet, with traders mostly on the sidelines. CoinGlass data shows VET open interest has seen marginal growth of 0.04%, reaching $62.36 million.
However, liquidation data reveal a wipeout of bullish traders worth $76,390 in long liquidations. In contrast, short liquidations were just $2,000, indicating that most wiped-out positions were bullish. This has lowered the long-to-short ratio to 0.9459 over the past 24 hours, indicating that active bearish positions outnumber long positions.
By:
Previous
Why Every Serious Investor Needs at Least 10,000 XRP for Long-Term Gains
Next
What If Shiba Inu Hit Elon Musk’s Net Worth? The SHIB Price Would Shock You
