BTCC
/
BTCC Square
/
Thecryptobasic
/
Bitcoin Smashes Bearish Expectations—Analyst Calls This the Hallmark of a True Bull Run
Bitcoin Smashes Bearish Expectations—Analyst Calls This the Hallmark of a True Bull Run

11
1
Bitcoin just pulled off a classic bullish power move—shrugging off what should've been a major downturn. One top analyst points to this resilience as the defining feature of every historic crypto uptrend.
While traditional markets fret over 'overbought' signals (as if they've ever stopped Wall Street's casino logic), BTC's defiance hints at deeper momentum. The pattern-breaker? Institutional money finally playing the long game—or just hedging against the next fiat currency meltdown.
Either way, the king of crypto isn't asking for permission to climb. Again.
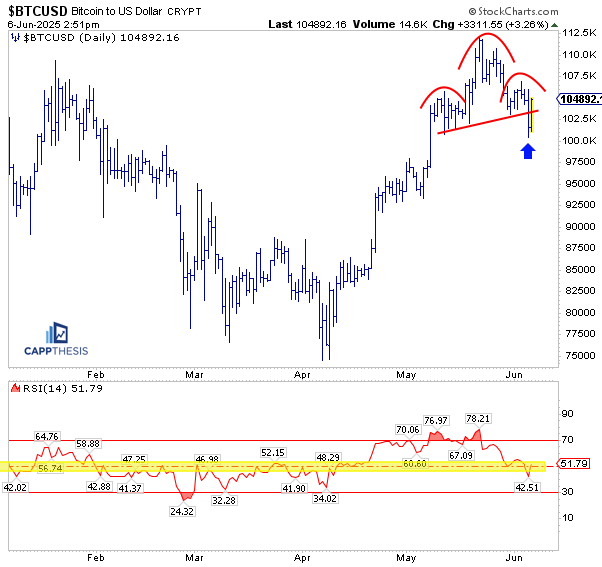 Bitcoin Head and Shoulders Pattern | Cappelleri
Furthermore, the head formed when bitcoin hit its all-time high of $111,200 on May 22, with the right shoulder of $106,843 on June 3 completing the bearish pattern. Following the formation of this structure, analysts expect BTC to begin a downward trend once it breaks below the neckline.
Interestingly, the premier asset broke down from the structure’s base two days ago, confirming the beginning of the downtrend.
Nonetheless, Bitcoin’s rebound has pushed prices above the base again, with Cappelleri suggesting that it might have defied the bearish trend. The top analyst noted that the trend indicates a key characteristic of an uptrend, insisting that BTC has not yet exhausted its bullish momentum.
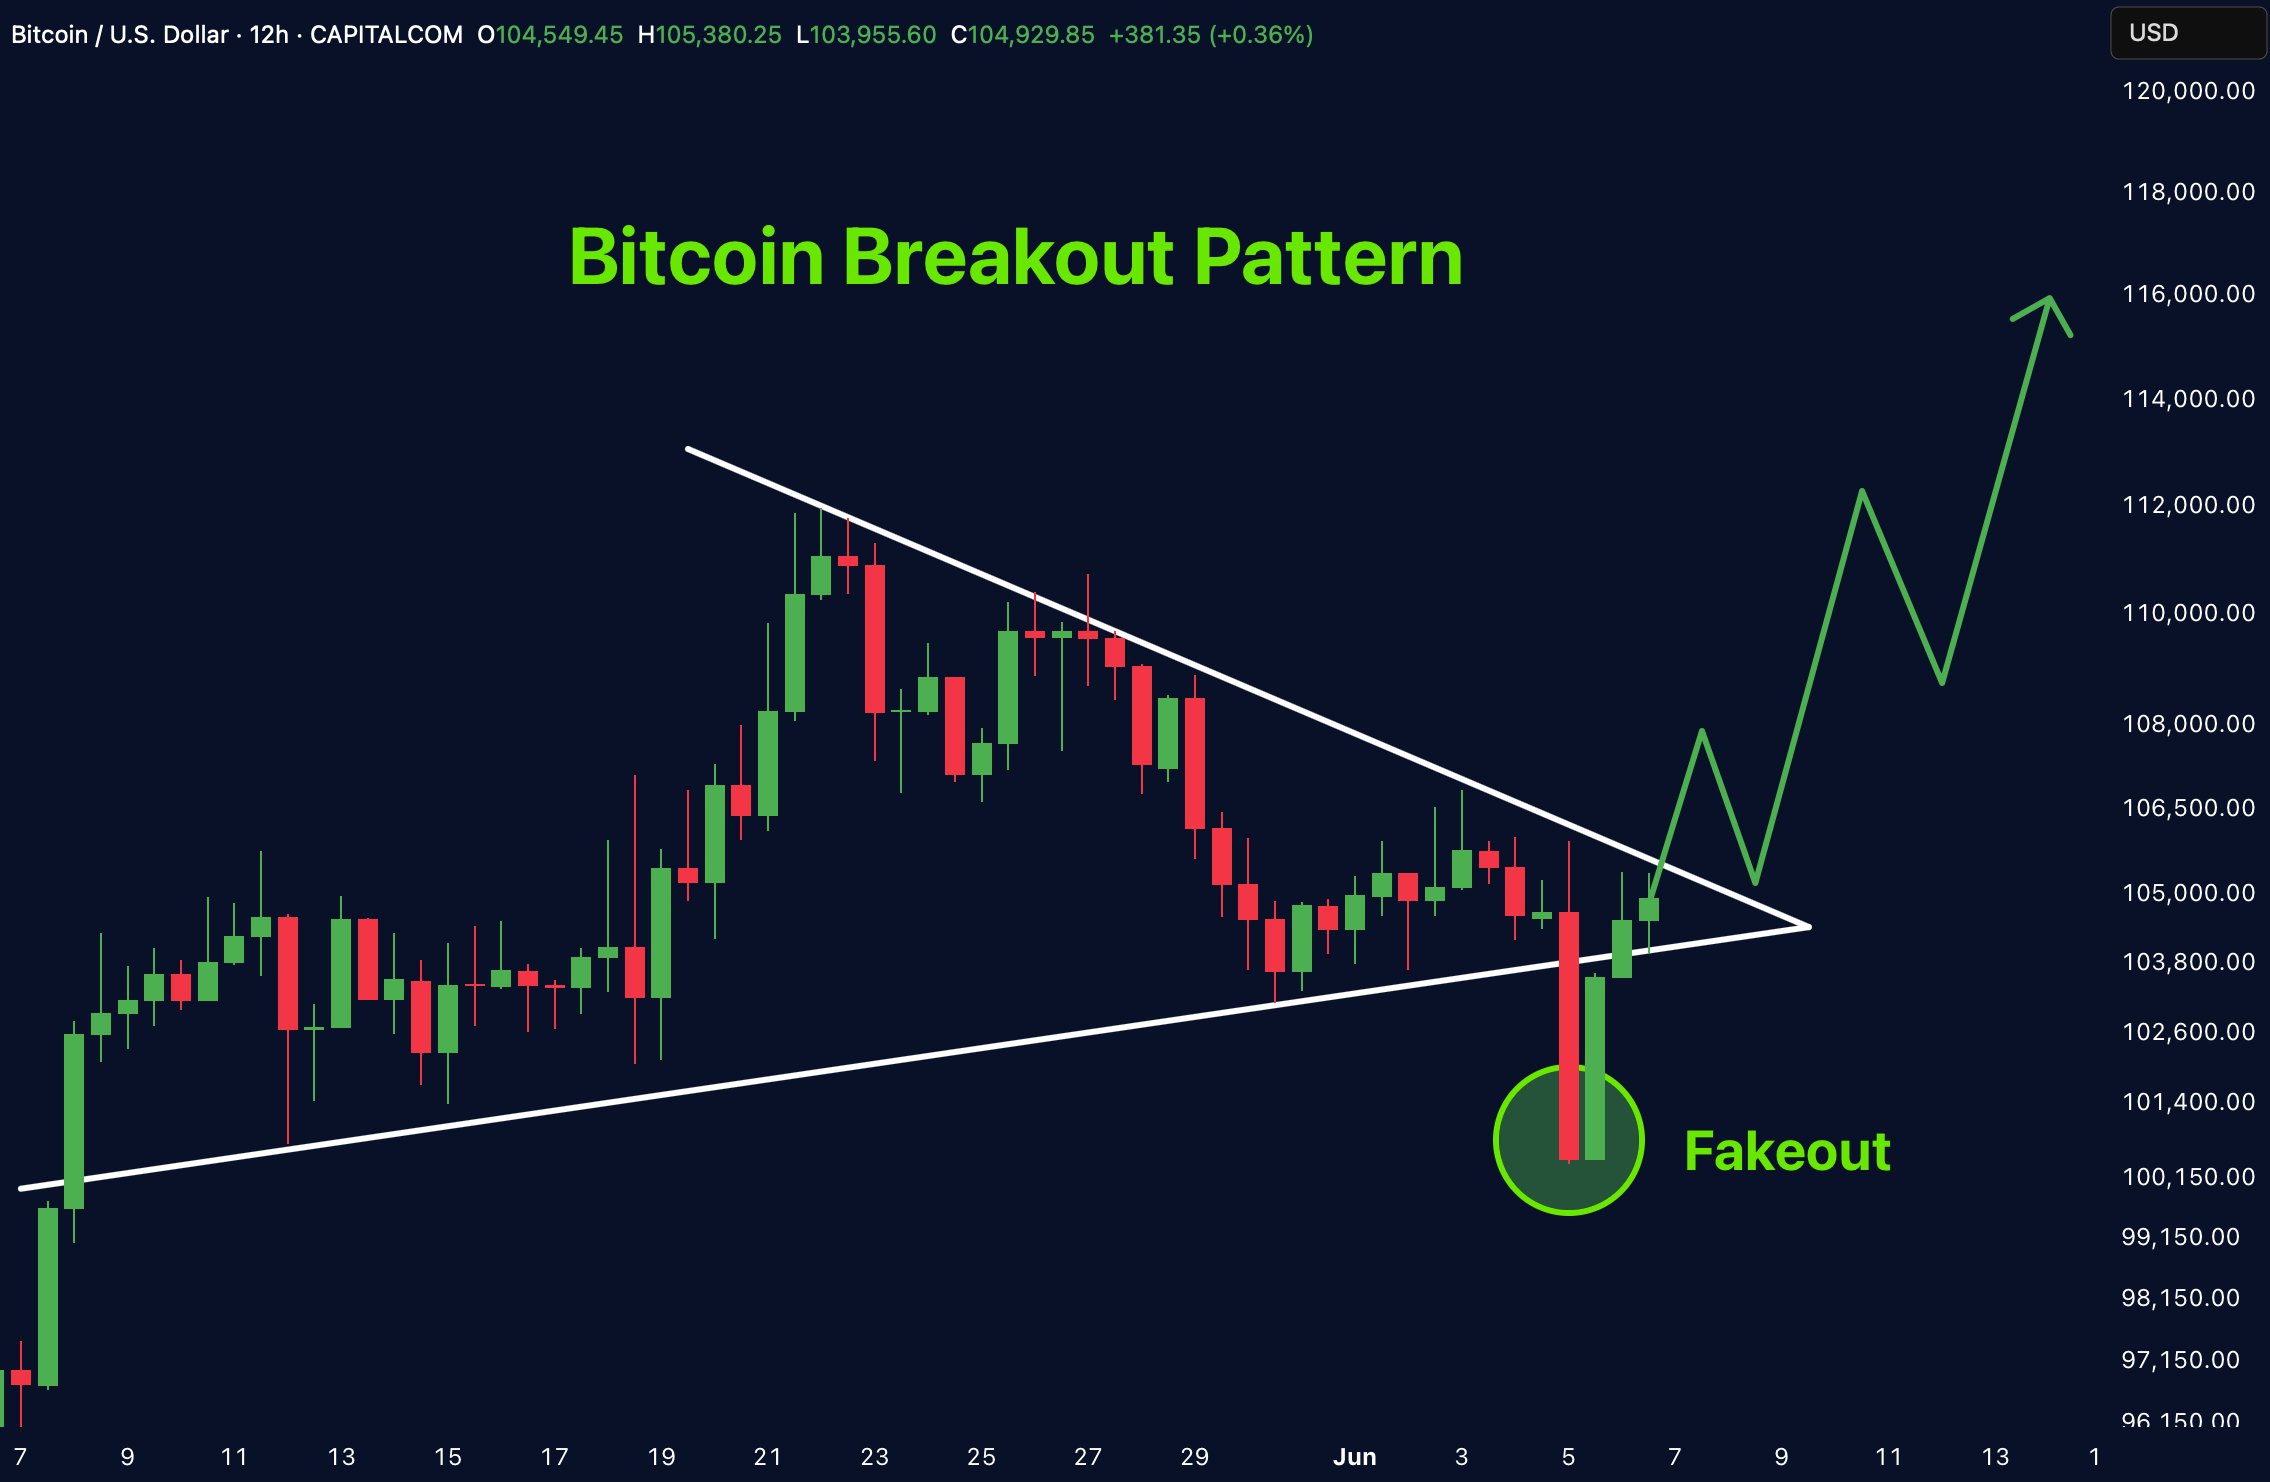
Bitcoin Fakeout Suggests a Breakout Is Imminent
Moreover, a parallel tweet identifies a new perspective on Bitcoin’s recent price action. Merlijn The Trader shared today that the asset is on the cusp of breaking out after temporarily shaking off weak hands with a fakeout.
Bitcoin Head and Shoulders Pattern | Cappelleri
Furthermore, the head formed when bitcoin hit its all-time high of $111,200 on May 22, with the right shoulder of $106,843 on June 3 completing the bearish pattern. Following the formation of this structure, analysts expect BTC to begin a downward trend once it breaks below the neckline.
Interestingly, the premier asset broke down from the structure’s base two days ago, confirming the beginning of the downtrend.
Nonetheless, Bitcoin’s rebound has pushed prices above the base again, with Cappelleri suggesting that it might have defied the bearish trend. The top analyst noted that the trend indicates a key characteristic of an uptrend, insisting that BTC has not yet exhausted its bullish momentum.
Bitcoin Fakeout Suggests a Breakout Is Imminent
Moreover, a parallel tweet identifies a new perspective on Bitcoin’s recent price action. Merlijn The Trader shared today that the asset is on the cusp of breaking out after temporarily shaking off weak hands with a fakeout.
By:
