XRP’s Decade of Bull Flags Hints at an Explosive Rally Ahead

20
2
Forget ’slow and steady’—XRP’s chart history reads like a thriller. Since 2015, the asset’s bull flags have consistently preceded major runs. Now, analysts whisper this could be the mother of all breakouts.
Patterns don’t lie (until they do). Each consolidation phase since 2015 has birthed a bigger rally than the last. The math? This next move could dwarf them all—assuming the SEC doesn’t throw another regulatory wrench in the works.
Timing the market is a fool’s errand, but XRP’s technicals scream opportunity. Just don’t bet the farm—this is crypto, where even ’sure things’ crash harder than Lehman Brothers’ stock.
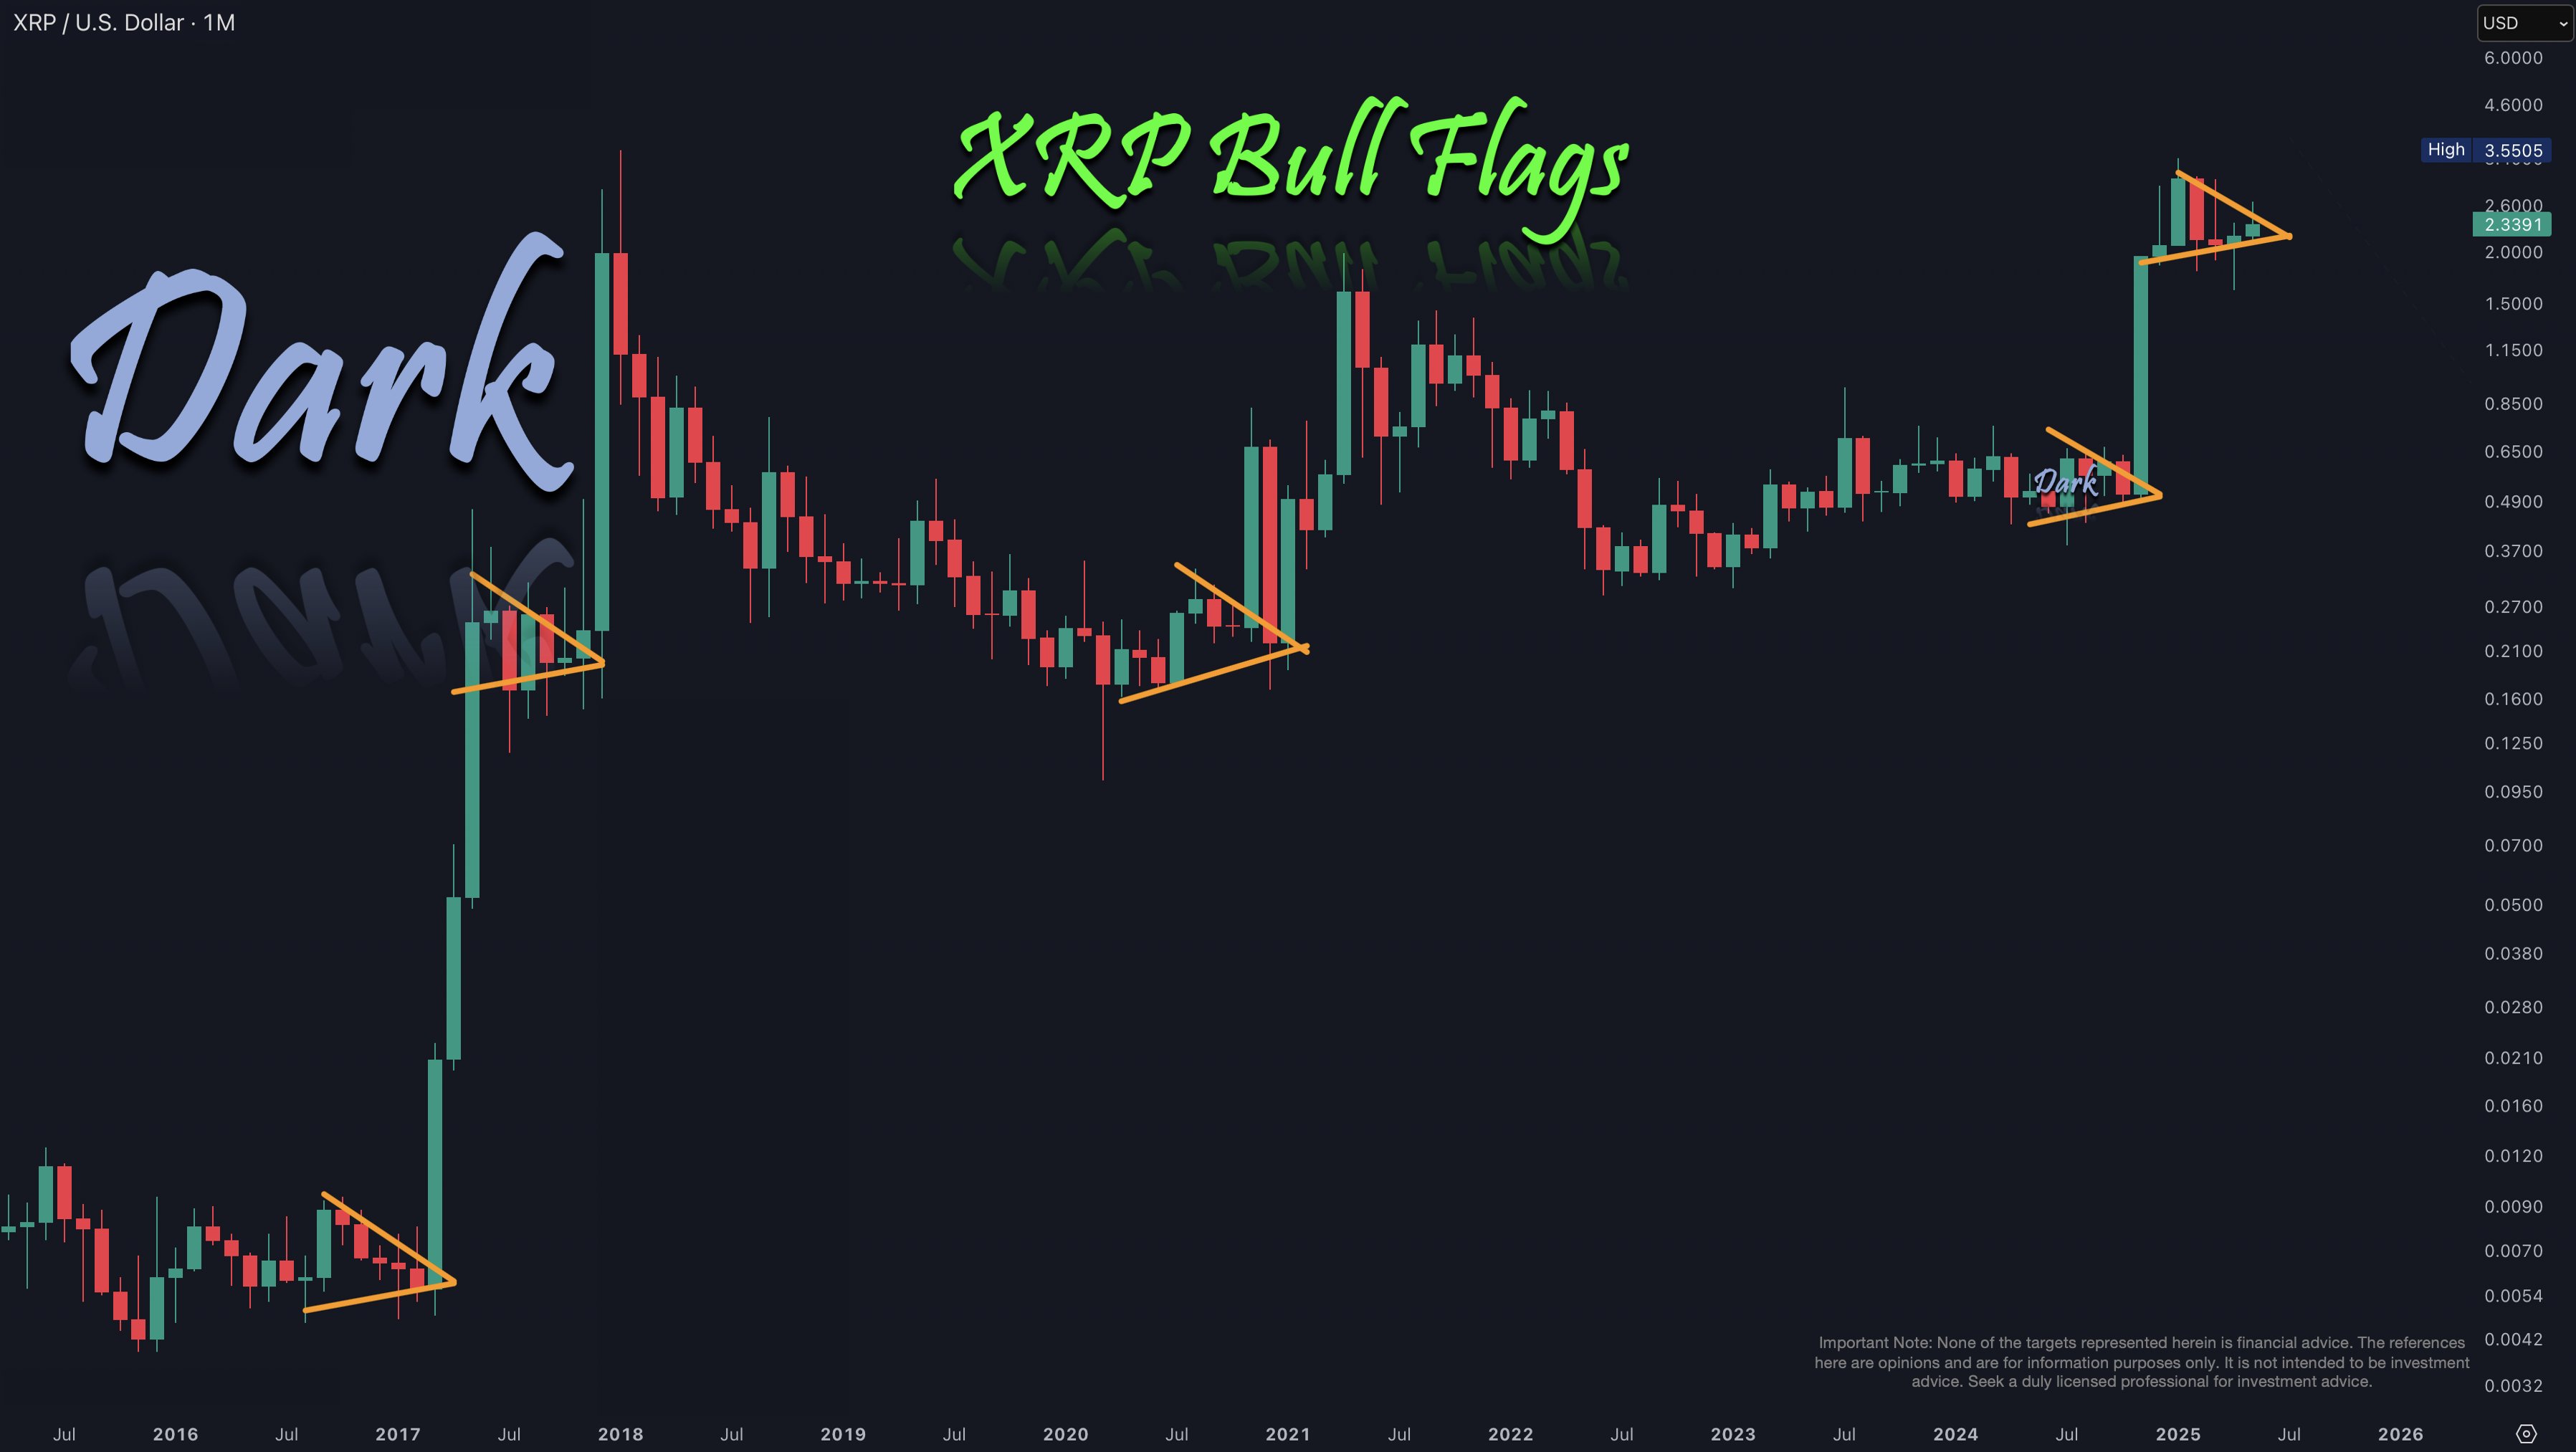 Historically, XRP formed its first major bull flag starting in 2017. At that time, the price consolidated near $0.0054 before surging above $0.2 to complete the flag formation. The breakout that followed propelled XRP to an all-time high of $3.5 in January 2018. After this, a prolonged consolidation phase confirmed the pattern through 2020.
XRP Gearing For Further Upside
More recently, XRP established a second flagpole after consolidating below $0.6 and then surging to $3.3 in January 2025. After this high, the bull flag formed and has persisted amid the ongoing consolidation. Although the breakout hasn’t happened yet, it suggests that XRP may be gearing up for a substantial upward surge.
Dark Defender’s view indicates that XRP’s market potential remains largely untapped. This technical formation signals a buildup of momentum, often leading to rapid and significant price surges once resolved. Essentially, XRP could be gearing up for a move that many current investors have yet to experience.
Breakout Signs Emphasized by Analyst Poseidon
Meanwhile, market analyst Poseidon has shared insights into XRP’s price behavior amid ongoing consolidation. Data from Poseidon’s chart shows that XRP has traded primarily between $2 and $3 during this phase.
The $3 level has acted as resistance, while the $2 mark serves as support. XRP has occasionally pushed beyond these levels but faced swift price corrections that returned it to the range.
Poseidon identifies three technical signals supporting a possible bullish breakout: a failed breakdown below support, reclaiming the 200 Exponential Moving Average (EMA) on the 12-hour chart, and a recent higher high formed when XRP reached $2.36 on May 26.
Additionally, Poseidon points to a descending trendline restricting price action since the May 12 high of $2.6. For a confirmed breakout, XRP must surpass $2.4 to break this trendline.
If the breakout occurs, Poseidon’s price target is $4, which WOULD require about a 73% increase from XRP’s current $2.31 level.
Historically, XRP formed its first major bull flag starting in 2017. At that time, the price consolidated near $0.0054 before surging above $0.2 to complete the flag formation. The breakout that followed propelled XRP to an all-time high of $3.5 in January 2018. After this, a prolonged consolidation phase confirmed the pattern through 2020.
XRP Gearing For Further Upside
More recently, XRP established a second flagpole after consolidating below $0.6 and then surging to $3.3 in January 2025. After this high, the bull flag formed and has persisted amid the ongoing consolidation. Although the breakout hasn’t happened yet, it suggests that XRP may be gearing up for a substantial upward surge.
Dark Defender’s view indicates that XRP’s market potential remains largely untapped. This technical formation signals a buildup of momentum, often leading to rapid and significant price surges once resolved. Essentially, XRP could be gearing up for a move that many current investors have yet to experience.
Breakout Signs Emphasized by Analyst Poseidon
Meanwhile, market analyst Poseidon has shared insights into XRP’s price behavior amid ongoing consolidation. Data from Poseidon’s chart shows that XRP has traded primarily between $2 and $3 during this phase.
The $3 level has acted as resistance, while the $2 mark serves as support. XRP has occasionally pushed beyond these levels but faced swift price corrections that returned it to the range.
Poseidon identifies three technical signals supporting a possible bullish breakout: a failed breakdown below support, reclaiming the 200 Exponential Moving Average (EMA) on the 12-hour chart, and a recent higher high formed when XRP reached $2.36 on May 26.
Additionally, Poseidon points to a descending trendline restricting price action since the May 12 high of $2.6. For a confirmed breakout, XRP must surpass $2.4 to break this trendline.
If the breakout occurs, Poseidon’s price target is $4, which WOULD require about a 73% increase from XRP’s current $2.31 level.
By:
Previous
Standard Chartered Doubles Down: Bitcoin’s 2025 Price Target Revealed
Next
XRP to $8 in 2025? Analyst’s Bold Prediction Sparks Debate—Hold the Champagne
