SUI Breaks Out: Rally Toward $6 All-Time High Gains Momentum

0
Another day, another crypto chart pattern begging to be overanalyzed. This time it’s SUI—carving a textbook rising channel like it’s trying to impress a TA-obsessed hedge fund intern.
The setup? A clean uptrend with higher lows, flirting with a potential breakout. Target? That shiny $6 ATH from the project’s speculative heyday. Because nothing screams ’sound investment’ like chasing previous price peaks, right?
Whether this is organic demand or just leveraged traders front-running the next ’altseason’ narrative remains to be seen. But one thing’s certain: the charts won’t interpret themselves—and neither will the eventual profit-taking dump.
 SUI Price Chart
Currently, SUI is forming higher lows within a rising channel. This structure emerged after the price bounced off the 23.60% trend-based Fibonacci level at $3.30.
The bullish recovery has led to a golden crossover, with the 50-day EMA crossing above the 200-day EMA. In addition, there’s a positive crossover between the 50- and 100-day EMAs, reinforcing bullish momentum.
Adding to the case for an extended rally, the daily RSI line shows a hidden bullish divergence, forming a lower low while the price continues to rise within the channel.
Thus, technical indicators support the potential for further upside in SUI. The 38.20% Fibonacci level, serving as immediate resistance at $4.6335, represents a 20% upside if the trend holds.
With broader market recovery, the SUI bull run could optimistically reach the 50% Fibonacci level at $6.08, setting a new all-time high.
On the downside, if SUI fails to maintain support at the lower boundary of the rising channel, a retest of the 50-day EMA NEAR $3.31 is likely.
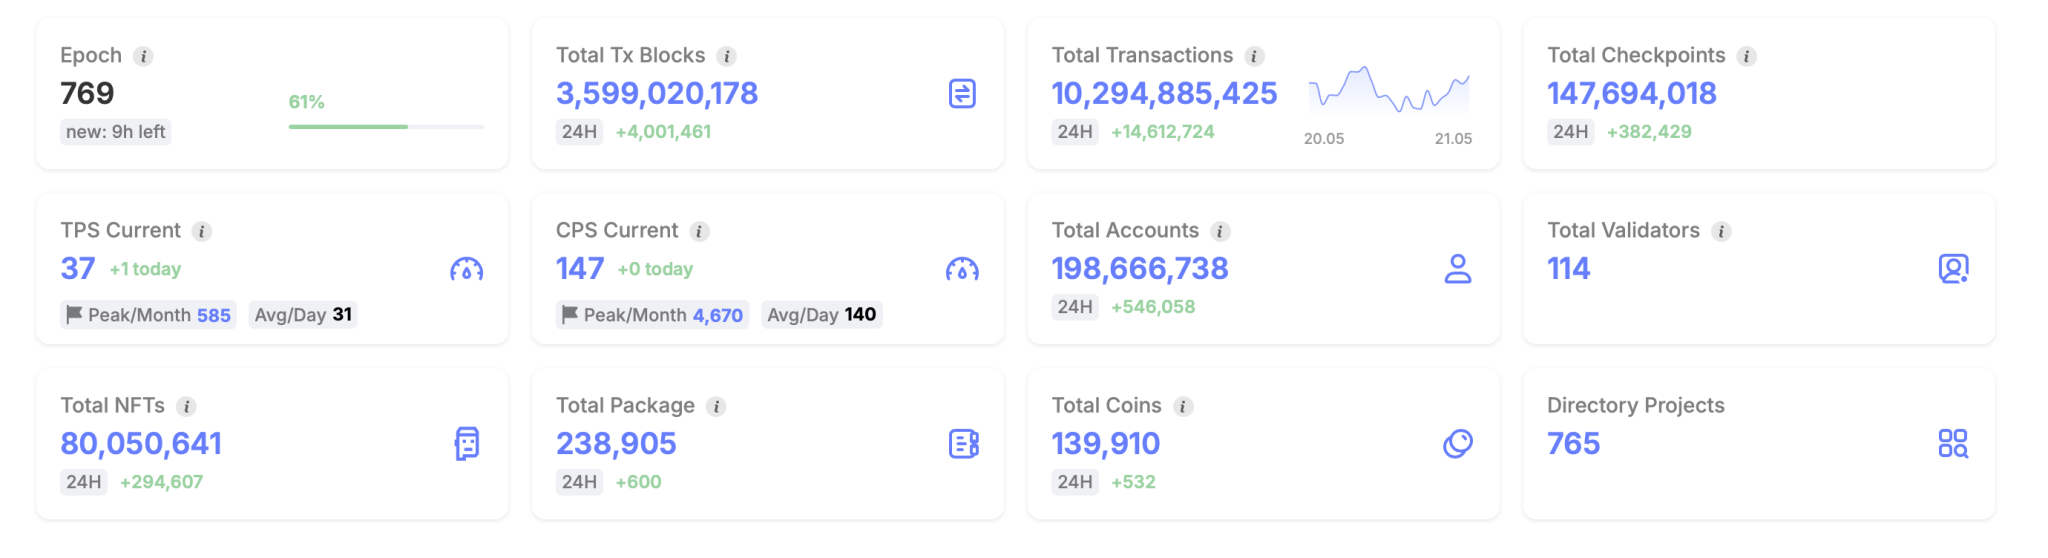
SUI Network Expansion Drives TVL Above $2 Billion
Bolstering the bullish outlook, the SUI network continues to grow. According to SuiScan, total value locked (TVL) has surpassed $2 billion, with total transactions exceeding $10 billion.
SUI Price Chart
Currently, SUI is forming higher lows within a rising channel. This structure emerged after the price bounced off the 23.60% trend-based Fibonacci level at $3.30.
The bullish recovery has led to a golden crossover, with the 50-day EMA crossing above the 200-day EMA. In addition, there’s a positive crossover between the 50- and 100-day EMAs, reinforcing bullish momentum.
Adding to the case for an extended rally, the daily RSI line shows a hidden bullish divergence, forming a lower low while the price continues to rise within the channel.
Thus, technical indicators support the potential for further upside in SUI. The 38.20% Fibonacci level, serving as immediate resistance at $4.6335, represents a 20% upside if the trend holds.
With broader market recovery, the SUI bull run could optimistically reach the 50% Fibonacci level at $6.08, setting a new all-time high.
On the downside, if SUI fails to maintain support at the lower boundary of the rising channel, a retest of the 50-day EMA NEAR $3.31 is likely.
SUI Network Expansion Drives TVL Above $2 Billion
Bolstering the bullish outlook, the SUI network continues to grow. According to SuiScan, total value locked (TVL) has surpassed $2 billion, with total transactions exceeding $10 billion.
By:

Log in to Reply
Log in to comment your thoughtsComments
Related Articles
|Square
Get the BTCC app to start your crypto journey
Get started today Scan to join our 100M+ users