Shiba Inu Crashes 10%—Can the Meme Coin Cling to $0.000015?

19
2
Shiba Inu’s latest plunge tests trader patience—and the so-called ’support level’ that’s really just a number on a screen. Will the dogs have their day, or is this another ’buy the dip’ trap set by crypto’s casino economics?
Technical analysts eye $0.000015 as the make-or-break zone. Break below, and the next stop might be ’well, we had fun’ territory. Hold, and the degens get another round of hopium.
Meanwhile, Bitcoin barely flinches—because when the ’institutional adoption’ narrative crumbles, the OG crypto still plays by its own rules. Meme coins? They dance on the graves of bagholders.
 Shiba Inu price chart
With a pullback of nearly 10% over the past three days, Shiba Inu now makes its third consecutive negative candle and trades at a market price of $0.00001518. With a 24-hour low at $0.00001479, the lower price direction in the daily candle reflects the bullish struggle to hold above the demand zone.
Furthermore, it highlights the retest of the recently broken inverted head-and-shoulder patterns. Amid the retest, the daily RSI line has dropped from the overbought region to the 14-day SMA at near 57.36. As the momentum declines, the possibility of a post-retest turnaround increases.
Considering the bulls’ regained momentum, the pattern breakout could target the 78.60% Fibonacci level at the psychological level of $0.000025. On the flip side, a bullish failure to hold above the demand zone will likely test the 50 EMA at $0.00001365. The next crucial support under the 50 EMA is the psychological support of $0.000010.
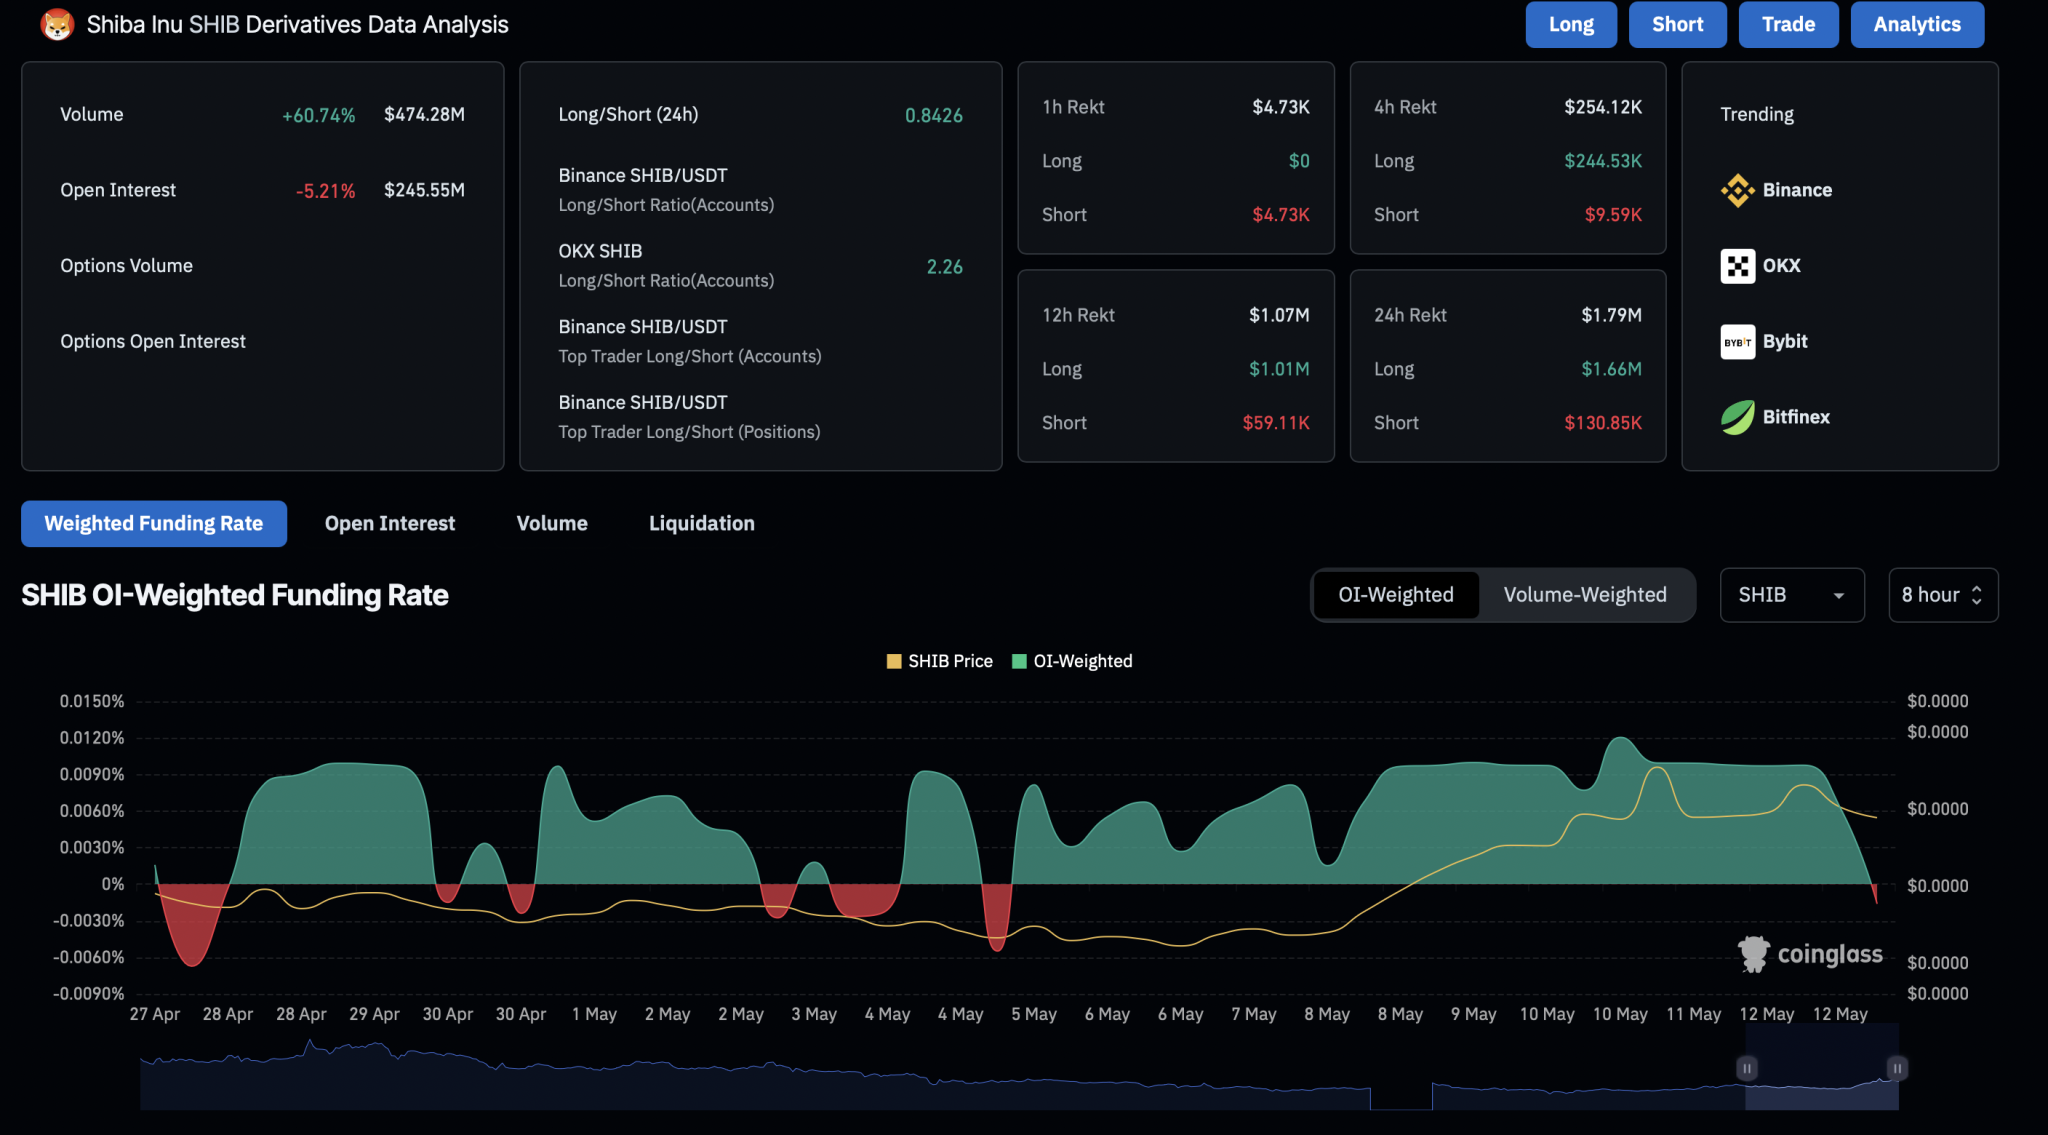
Derivative Traders Grab SHIB at Lower Prices
As the bearish influence grows over the shiba inu price chart, the derivatives market witnesses increased volatility. Based on Coinglass data, the funding rate has flipped negative to -0.0016%, with the open interest down by 5.21% at $245.55 million.
Shiba Inu price chart
With a pullback of nearly 10% over the past three days, Shiba Inu now makes its third consecutive negative candle and trades at a market price of $0.00001518. With a 24-hour low at $0.00001479, the lower price direction in the daily candle reflects the bullish struggle to hold above the demand zone.
Furthermore, it highlights the retest of the recently broken inverted head-and-shoulder patterns. Amid the retest, the daily RSI line has dropped from the overbought region to the 14-day SMA at near 57.36. As the momentum declines, the possibility of a post-retest turnaround increases.
Considering the bulls’ regained momentum, the pattern breakout could target the 78.60% Fibonacci level at the psychological level of $0.000025. On the flip side, a bullish failure to hold above the demand zone will likely test the 50 EMA at $0.00001365. The next crucial support under the 50 EMA is the psychological support of $0.000010.
Derivative Traders Grab SHIB at Lower Prices
As the bearish influence grows over the shiba inu price chart, the derivatives market witnesses increased volatility. Based on Coinglass data, the funding rate has flipped negative to -0.0016%, with the open interest down by 5.21% at $245.55 million.
By:
Previous
Dogecoin Stumbles: Can the Meme Coin Rebound to $0.20 After Latest Dip?
Next
XRP’s Path to $33: Analyst Unveils High-Stakes Sell Strategy as Historical Trends Signal Continued Rally
